Bitcoin drops to $60,000 as two investor groups give up — this on-chain data indicates the sellers are ahead
The Bitcoin decline around $60,000 in February was a panic sell event in a single day that many will remember as a bottom formation signal. However, a more accurate interpretation shows that the capitulation sell-off did not happen in one sudden drop but occurred in multiple stages, with different groups of investors taking turns becoming the sellers.
A report on February 10th from Checkonchain views this decline as a rapid, large-volume capitulation event with enough losses to reset market psychology. At the same time, data indicates the market experienced another capitulation in November 2025, with a different seller structure.
To correctly identify the cycle’s weak points, one must look beyond the strongest red candle and focus on the question: who sold, and why did they have to sell?
On-chain Capitulation Selling and Realized Losses
Capitulation selling is when investors accept losses and exit positions in panic because they can no longer tolerate further declines. On-chain data leaves clear traces of this phenomenon through realized losses—that is, losses realized when assets are sold below their cost basis.
Data shows that the February decline created a record-scale loss realization wave, following a market cleansing several months earlier.
On the peak day:
- Short-term investors recorded approximately $1.14 billion in realized losses
- Long-term investors recorded about $225 million in realized losses
When total realized losses are netted against realized gains, the net loss reached about $1.5 billion per day during the most intense period. Considering only realized losses, both November 2025 and February 2026 were separate large-scale capitulation events, each exceeding $2 billion per day.
Separating these into two events helps explain why prices could appear stable and then continue to collapse: the risk-bearing groups are constantly changing. One group can withstand declines, but another cannot endure prolonged periods, the second drop, or realizing they bought the bottom too early.
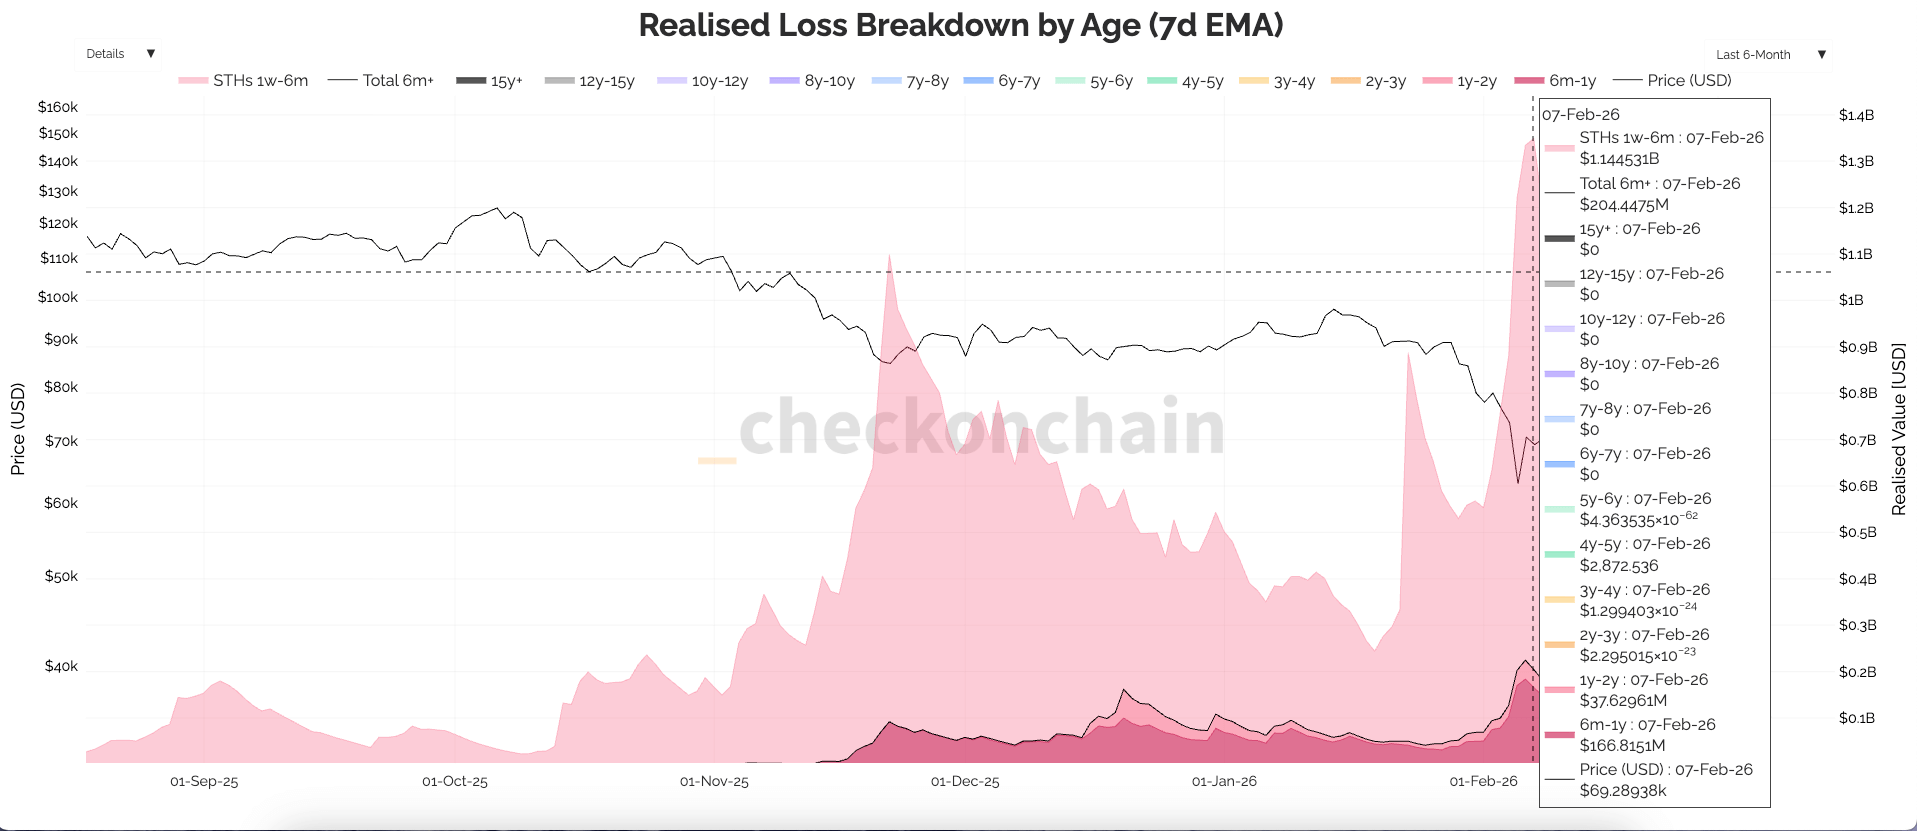 Chart showing actual Bitcoin losses by age group on February 7, 2026 (Source: Checkonchain)
Stage One: November 2025 — Exhaustion and Surrender
The first capitulation occurred in November 2025 when prices fell to around $80,000. Most realized losses at that time came from investors who bought during 2025—accounting for about 95%.
Analyzing by “coin age groups” (classified by purchase time) allows estimating each group’s cost basis. From this, we can identify which groups are in loss, which are still in profit, and calculate the network’s average cost basis.
This sell-off was characterized by fatigue. After a long sideways period amid macroeconomic uncertainty, many investors lost patience. Holding pressure turned into price pressure, prompting them to exit.
Unlike previous downturns—often ending with a final crash—this cycle released pressure early and gradually through a prolonged sideways phase, eroding confidence before a sharp breakdown.
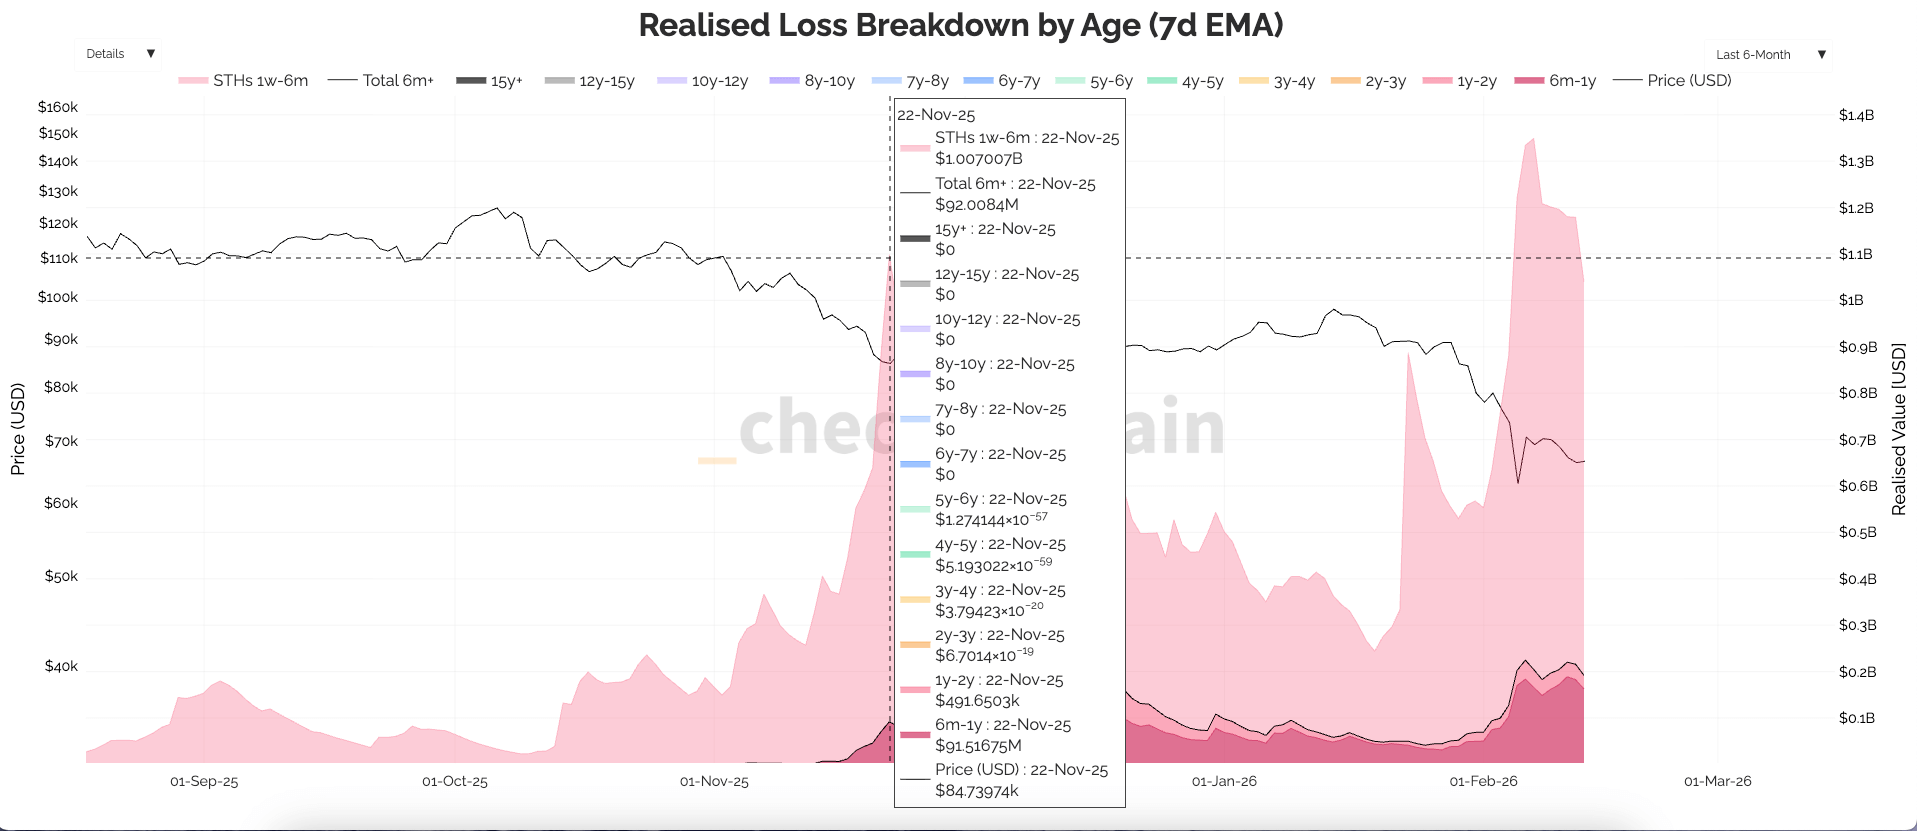 Chart showing actual Bitcoin losses by age group on November 22, 2025 (Source: Checkonchain)
Stage Two: February 2026 — Surrender Due to Loss of Confidence in Bottoming
The second phase in February had a different tone. Prices touched the $60,000 zone, and the seller structure was evenly split between the 2025 buyers and the 2026 buyers. This means new buyers had become the sellers.
The 2026 buyers mainly entered in the $80,000–$98,000 range, believing that was the bottom. When prices continued to fall, their confidence shattered, forcing them to realize losses.
The remaining 2025 group likely sold out of regret for not reducing risk at $80,000 and decided to exit at $60,000. Investors usually don’t sell just because they’re in loss; they sell because they missed earlier exit opportunities and want to avoid repeating mistakes.
In November, the market primarily cleansed a layer of buyers. By February, two groups were eliminated simultaneously: exhausted holders and those who bottomed too early. As a result, realized losses surged, and sentiment became especially negative.
The February event is considered the largest absolute USD loss event in history, with net losses around $1.5 billion per day, while profit-taking activity was low—indicating a large-scale forced liquidation wave.
Trading Volume Confirms Capitulation Selling
Capitulation sell-offs are always accompanied by surges in trading volume. Activity spikes across spot markets, ETFs, futures, and options:
- Spot trading around $15.4 billion per day
- ETF volume reaching about $45.6 billion weekly, a record high
- Futures exceeding $107 billion daily
- Options around $12 billion daily, double the previous month
This reflects a strong re-pricing process: sellers forced to sell meet buyers with high confidence.
The Bottom Is a Price Range Near Cost Basis, Not a Single Point
After a sharp pullback, markets often debate a specific bottom figure. But in reality, the bottom usually forms around cost basis levels, not at a single point in time.
Two key reference points are:
- On-chain average cost basis around $55,000
- Long-term market average around $79,400
The bottom formation typically begins below the long-term average but above the on-chain cost basis. If prices are above the network’s cost basis, most of the market is not broadly in loss. If below the long-term average, absorption of losses continues.
Combining this with changes in seller groups, it becomes clear that the February decline was not a “decisive line,” but a point where forced sellers encountered sufficient buying support.
The Focus Is Not When the Bottom Occurs, But Who Has Left the Market
This cycle did not distribute pain in a single crash but in two phases: a sideways phase draining confidence, followed by a rapid decline forcing many groups to realize losses simultaneously.
Therefore, the key question is not which month the bottom fell, but which investor groups were eliminated. After two capitulation waves, most marginal sellers have exited the market.
The next phase is usually digestion: realized loss pressure diminishes, prices fluctuate around cost basis zones, and risk appetite gradually rebuilds. The first two capitulation waves do not guarantee an immediate price rebound, but they show that weaker hands have left and the holder structure has changed.
Related Articles
Bitcoin Faces Worst Q1 in Eight Years as ETF Outflows and Volatility Rise
Capital B Expands Bitcoin Holdings Amid Strong Treasury Strategy
Strategy Says $49B Bitcoin Reserve Can Withstand Severe Price Crash to $8K
Honduran Bitcoin Utopia Prospera Faces Uncertainty After Government Change
Data: 164.59 BTC transferred from an anonymous address, then routed through a relay and sent to another anonymous address