Hedera price plummets, selling pressure continues to dominate
Hedera (HBAR) price continues to decline in a bearish trend as it extends its downward move and trades below the $0.103 level at the time of writing on Tuesday, after losing nearly 4% in the previous session. On-chain indicators and derivatives markets are both showing negative signals, combined with technical indicators that are not very optimistic, reinforcing a bearish scenario and increasing the risk of HBAR entering a deeper correction in the near future.
On-chain and derivatives data indicate a downtrend
Social Dominance data from Santiment further supports a negative outlook for Hedera. This index reflects the proportion of discussions related to HBAR across crypto media. Since late December, Social Dominance has been in a clear declining trend and continued to fall sharply in February, reaching just 0.018% on Tuesday. This movement indicates waning market interest and reflects increasingly negative investor sentiment toward HBAR.
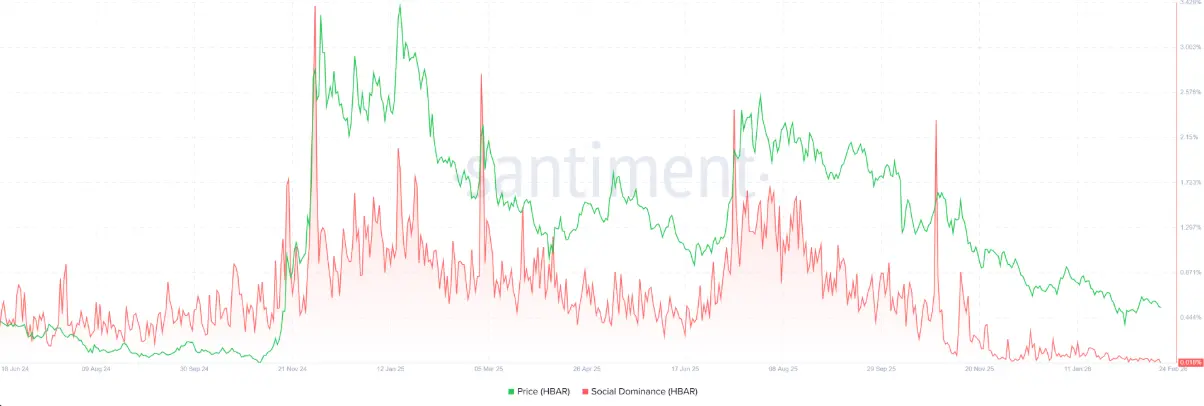 HBAR Social Dominance Chart | Source: Santiment
In the derivatives market, Hedera futures open interest (OI) also looks bleak, dropping to $92.15 million on Tuesday. The downward trend has been ongoing since early January, and OI is approaching the February 6 low of $88.89 million. The continuous contraction of OI suggests weakening capital flow and investor participation, highlighting a short-term bearish outlook.
HBAR Social Dominance Chart | Source: Santiment
In the derivatives market, Hedera futures open interest (OI) also looks bleak, dropping to $92.15 million on Tuesday. The downward trend has been ongoing since early January, and OI is approaching the February 6 low of $88.89 million. The continuous contraction of OI suggests weakening capital flow and investor participation, highlighting a short-term bearish outlook.
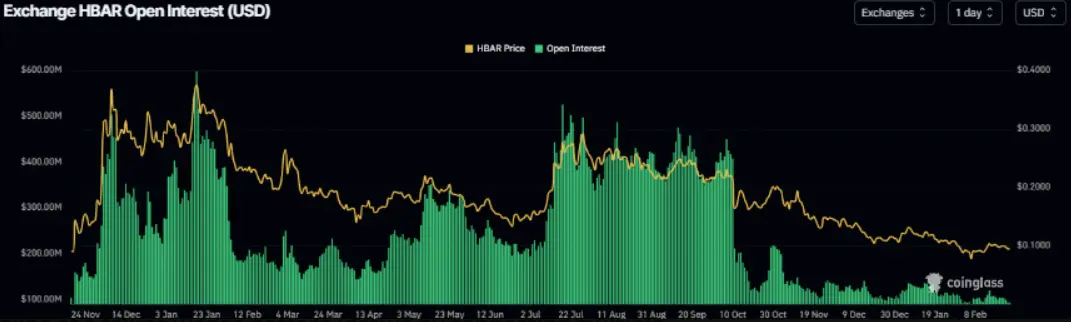 HBAR Open Interest Chart | Source: Coinglass
Hedera Price Forecast: Bears Target Deeper Correction
Hedera’s price failed to break above the 50-day exponential moving average (EMA) at $0.103 on February 14, leading to a sharp decline of about 8.5% through Monday. Notably, the 50-day EMA nearly coincides with the upper trendline of a falling wedge pattern — formed by connecting the highs and lows since late June — making this area a key technical resistance. As of Tuesday, HBAR is trading around $0.094.
If selling pressure persists, HBAR could retreat to a critical support zone on the weekly timeframe at $0.090. Closing below this level could trigger a new wave of selling, pushing the price further down to the next daily support around $0.072 — the low established on October 10.
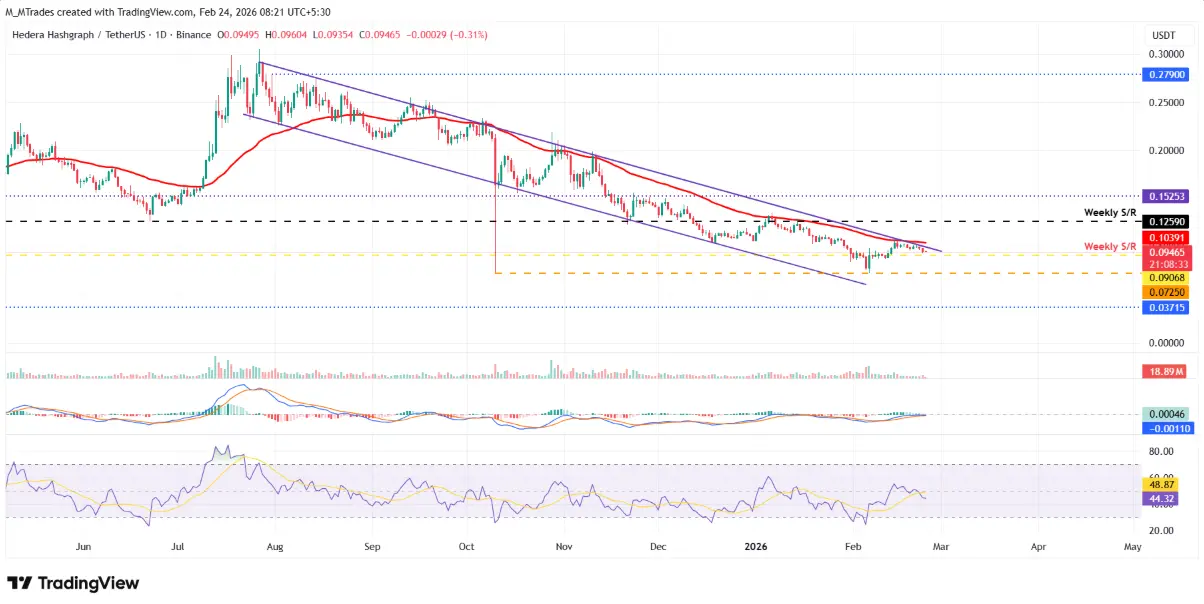 Daily HBAR/USDT Chart | Source: TradingView
Momentum indicators also lean toward a negative scenario. The Relative Strength Index (RSI) on the daily chart is at 44, below the neutral 50 level, and continues to weaken, indicating that the bearish momentum is gaining strength. Meanwhile, MACD lines are converging, suggesting market indecision. A bearish crossover in MACD would further confirm the short-term downside outlook.
Daily HBAR/USDT Chart | Source: TradingView
Momentum indicators also lean toward a negative scenario. The Relative Strength Index (RSI) on the daily chart is at 44, below the neutral 50 level, and continues to weaken, indicating that the bearish momentum is gaining strength. Meanwhile, MACD lines are converging, suggesting market indecision. A bearish crossover in MACD would further confirm the short-term downside outlook.
In a more optimistic scenario, if buying interest returns and HBAR recovers, the price could regain upward momentum and test the 50-day EMA at around $0.103 — a key resistance level that must be broken to reverse the trend.
Related Articles
When "stability" begins to fluctuate: A full review and structural analysis of the USD1 de-pegging event
Altcoins Up 10–20% as Breakout Hype Builds—Is a 50% Rally Next or Too Risky to Chase?
Pi Network merchants doubled to 148,000, with a 60% annual increase in migrated users
XRP Today's News: ETF Net Inflows Exceed 1.2 Billion, Institutional Demand Supports Mid-Term Outlook
Bitcoin dips gradually; buying more means losing more, discouraging buyers from entering the market