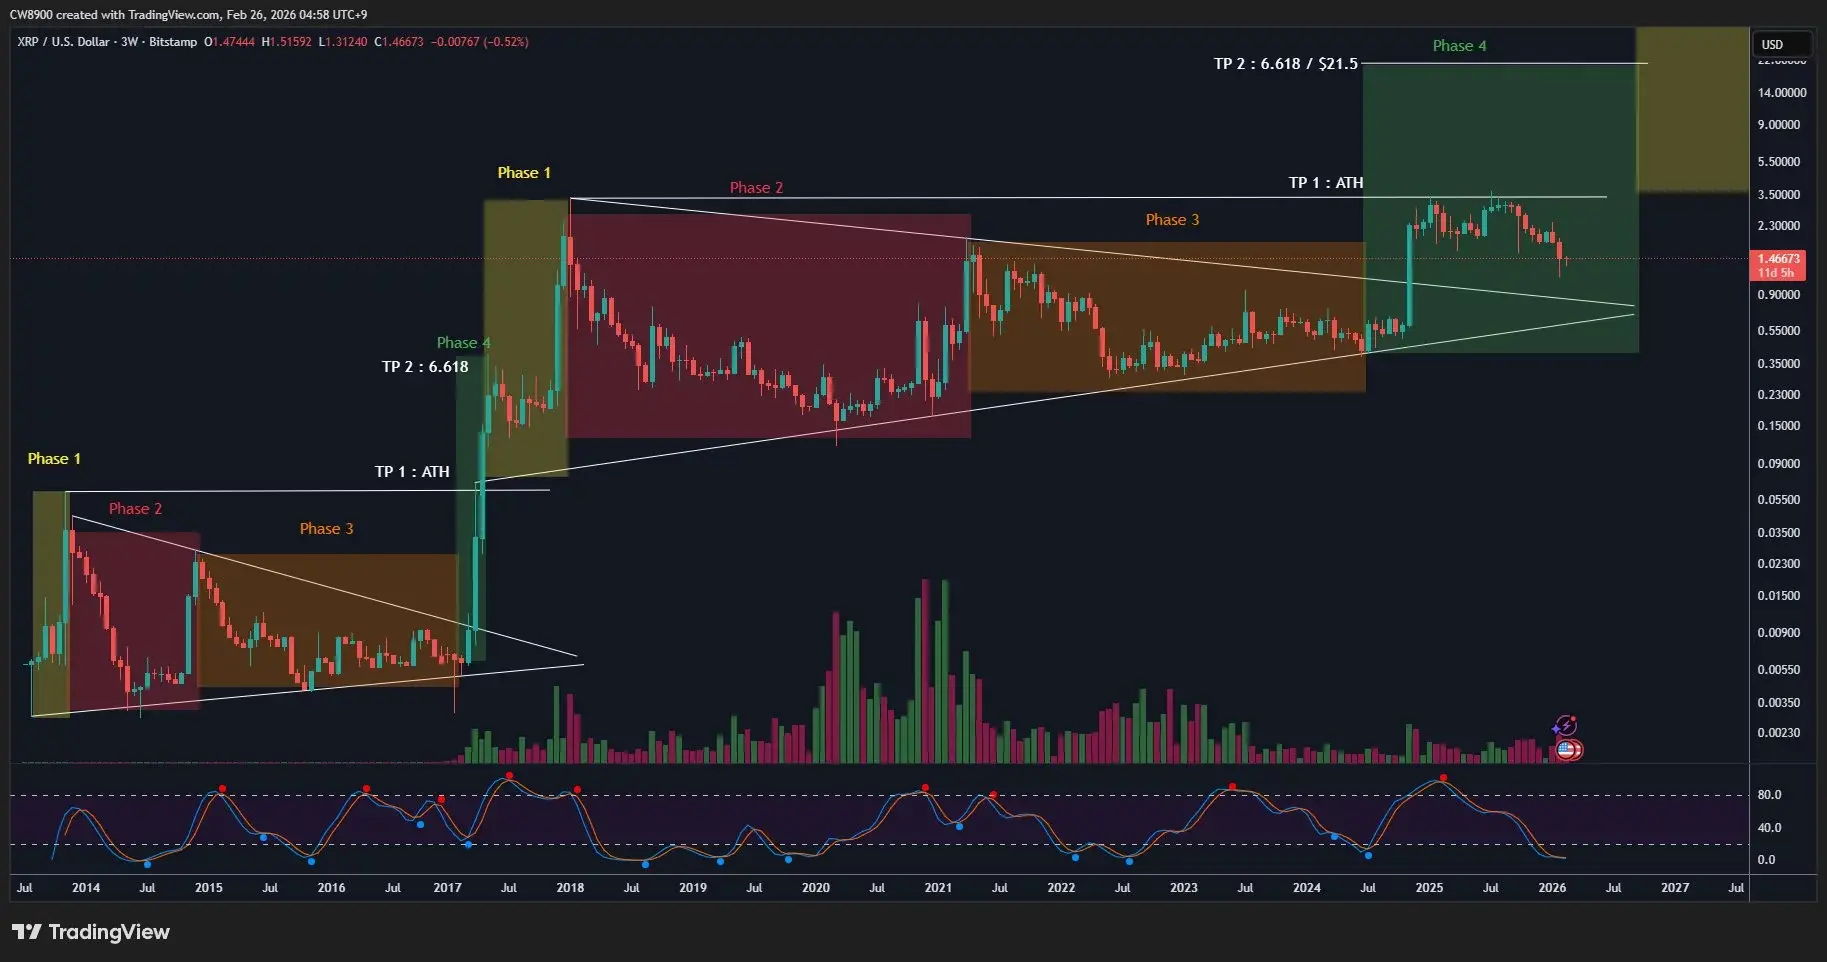
Will XRP price enter the "fourth phase" of an upward structure? The target after the symmetrical triangle breakout directly points to the all-time high
On February 26, news reports indicate that after intense volatility in February 2026, XRP’s price is currently fluctuating between $1.43 and $1.46. Several technical analysts are beginning to watch for potential trend reversal signals. One trader suggests that XRP may be approaching the so-called “Fourth Phase” of an upward trend, based on a long-term multi-cycle structural model.
 (Source: TradingView)
According to its chart framework, XRP’s historical movement can be divided into four phases: the first phase is accumulation and breakout, the second phase is a correction and consolidation, the third phase shows a converging compression structure, and the current market pattern appears to be at a critical transition point from compression to expansion. Notably, XRP has previously broken above a long-standing symmetrical triangle top, then retested near the trendline. Such technical retracements are often seen as confirmations before trend continuation.
(Source: TradingView)
According to its chart framework, XRP’s historical movement can be divided into four phases: the first phase is accumulation and breakout, the second phase is a correction and consolidation, the third phase shows a converging compression structure, and the current market pattern appears to be at a critical transition point from compression to expansion. Notably, XRP has previously broken above a long-standing symmetrical triangle top, then retested near the trendline. Such technical retracements are often seen as confirmations before trend continuation.
If the “Fourth Phase” is confirmed, the first target in the model points toward the historical high region, followed by higher Fibonacci extension levels. However, these distant price ranges remain speculative and require further validation through volume and macro liquidity changes. In short-term indicators, XRP’s momentum is gradually recovering. The 14-day RSI has risen to around 44, moving out of the oversold zone, indicating easing selling pressure but not yet entering a clear bullish zone.
Meanwhile, the price remains below the 50-day moving average, which is around $1.69 and serves as a key short-term resistance. If the price can effectively break above this level, it could reinforce market expectations of a trend reversal and increase the credibility of a short- to medium-term upward structure. On the downside, support levels at $1.30 to $1.35 remain critical for bulls, with stronger structural support near $1.20. A break below this could weaken the current reversal thesis.
Currently, XRP is at a sensitive stage of technical negotiation: if it maintains high-level sideways movement and gradually increases trading activity, the market may interpret this as a buildup phase; conversely, if key supports are broken, it could delay the upward structure. For investors monitoring XRP’s price movement, symmetrical triangle breakout patterns, and medium- to long-term trend phases, the resistance at $1.69 and support at $1.30 will be key reference zones for future direction.
Related Articles
XRP Clings to $1.41 Support as Traders Eye $1.46 Rebound Amid Descending Trendline Pressure