The CHZ price faces resistance as market signals remain mixed
Chiliz (CHZ) is currently in the red, trading below $0.035 at the time of writing on Thursday. This correction comes right after a 6% rebound in the previous session, amid a prevailing downtrend across the market. Meanwhile, mixed signals from on-chain data and derivatives markets continue to paint an unclear short-term outlook for CHZ, limiting the potential for a strong recovery in the near future.
Contradictory signals from CHZ traders
Aggregated data from CryptoQuant shows that Chiliz’s market picture is filled with conflicting signals, with early indicators leaning toward a negative trend. Activity in both spot and futures markets indicates that bears are clearly in control. In the derivatives sector, a sharp increase in retail investors and an overheated market reflect widespread bearish sentiment. However, the appearance of large-volume whale orders still offers a cautious glimmer of hope for CHZ.
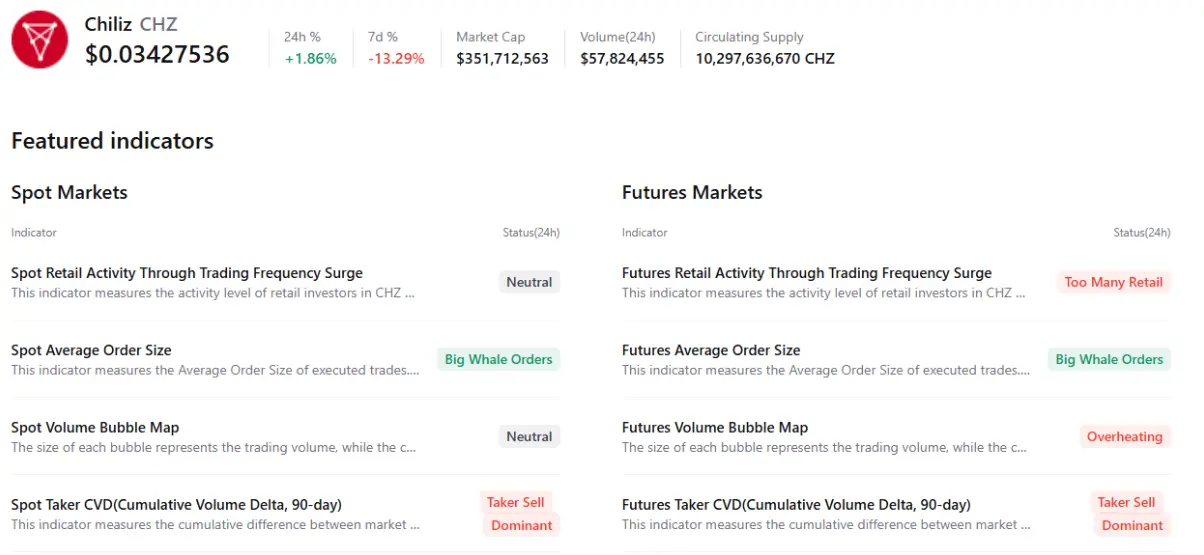 Chiliz Summary | Source: CryptoQuant
Derivatives indicators for CHZ continue to send mixed messages. According to data from CoinGlass, Chiliz’s long/short ratio was at 0.78 on Thursday. Maintaining this below 1 suggests most traders are leaning toward a price decline, reinforcing a defensive market sentiment.
Chiliz Summary | Source: CryptoQuant
Derivatives indicators for CHZ continue to send mixed messages. According to data from CoinGlass, Chiliz’s long/short ratio was at 0.78 on Thursday. Maintaining this below 1 suggests most traders are leaning toward a price decline, reinforcing a defensive market sentiment.
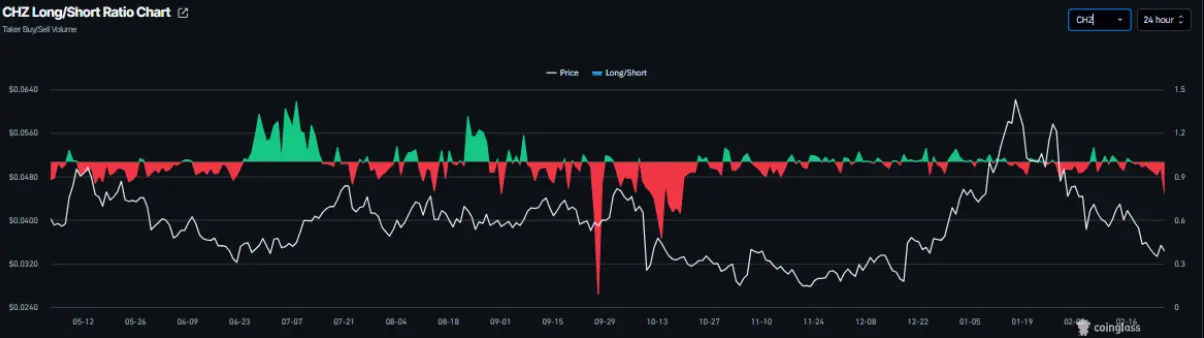 CHZ Long/Short Ratio Chart | Source: Coinglass
Conversely, the funding rate indicator appears more positive. The OI-Weighted Funding Rate shows that the number of traders betting on a price decrease is lower than those expecting an increase. Notably, this index turned positive on Saturday and reached 0.0022% on Thursday, implying long positions are paying fees to short positions.
CHZ Long/Short Ratio Chart | Source: Coinglass
Conversely, the funding rate indicator appears more positive. The OI-Weighted Funding Rate shows that the number of traders betting on a price decrease is lower than those expecting an increase. Notably, this index turned positive on Saturday and reached 0.0022% on Thursday, implying long positions are paying fees to short positions.
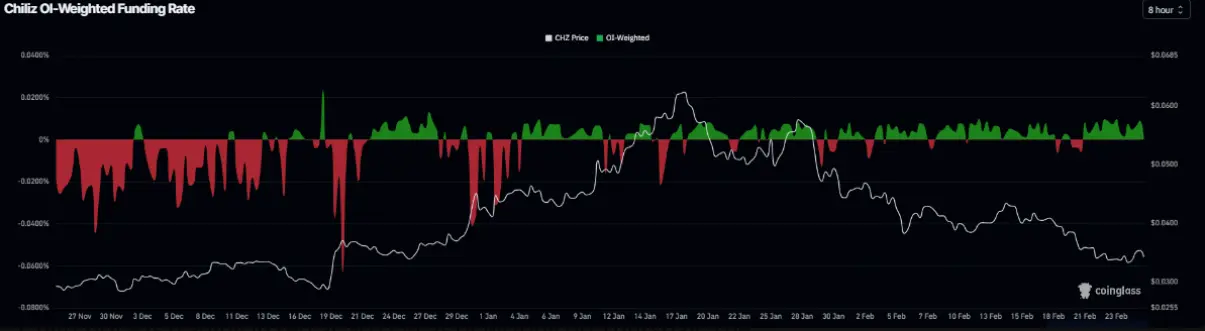 CHZ Funding Rate Chart | Source: Coinglass
Overall, these signals reflect investor hesitation and a lack of consensus among CHZ traders, which diminishes the likelihood of a strong and sustainable short-term recovery.
CHZ Funding Rate Chart | Source: Coinglass
Overall, these signals reflect investor hesitation and a lack of consensus among CHZ traders, which diminishes the likelihood of a strong and sustainable short-term recovery.
Chiliz Price Forecast: Overall Structure Still Bearish
As of Thursday, Chiliz is trading in the red around $0.034. The short-term outlook remains slightly bearish, with the price continuing to be suppressed below the long-standing downtrend line from the $0.064 high, and below both the 50-day and 100-day exponential moving averages (EMA). These EMAs are currently converging and forming a notable resistance zone around $0.040–$0.041.
On the daily chart, the RSI hovers around 37 and remains below the neutral 50 level, indicating that downside momentum has not shown clear signs of weakening. Meanwhile, the MACD remains in negative territory, with the MACD line below the signal line and a relatively shallow histogram — reflecting a gradual decline rather than a sharp sell-off.
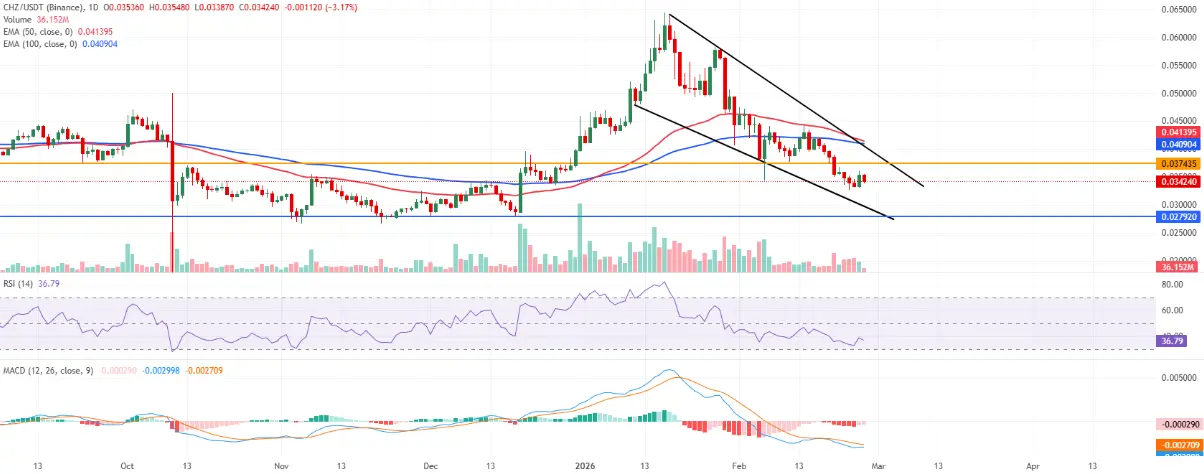 Daily CHZ/USDT Chart | Source: TradingView
Regarding key technical levels, the nearest resistance is identified at $0.037, aligning with a previous horizontal barrier. Higher up, the $0.040–$0.041 zone acts as a critical resistance area where the downtrend line and moving averages converge. A daily candle close above this zone could temporarily ease selling pressure.
Daily CHZ/USDT Chart | Source: TradingView
Regarding key technical levels, the nearest resistance is identified at $0.037, aligning with a previous horizontal barrier. Higher up, the $0.040–$0.041 zone acts as a critical resistance area where the downtrend line and moving averages converge. A daily candle close above this zone could temporarily ease selling pressure.
On the downside, the closest support is at $0.033, with a more significant support level at $0.027 — a horizontal level that holds structural importance. If this area is broken, Chiliz risks further declining to lower lows within the broader downtrend.