XRP Price Slumps as Open Interest Flashes Warning Signs - BTC Hunts
 The post XRP Price Slumps as Open Interest Flashes Warning Signs appeared first on Coinpedia Fintech News
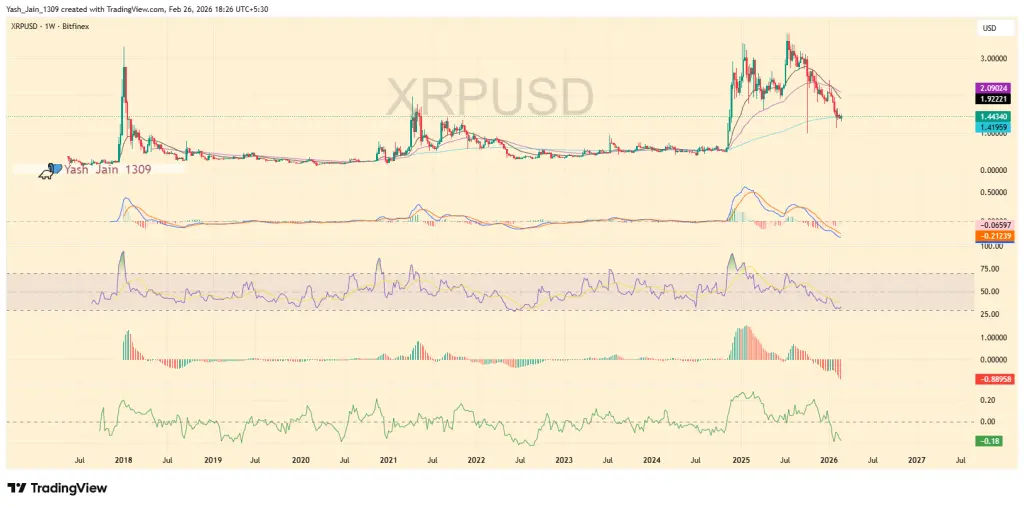
The XRP price isn’t exactly inspiring confidence right now. After a powerful 2025 rally that pushed XRP/USD above the $3 mark, the mood has shifted and not subtly. Price has rolled over hard, now hovering near the $1.44 zone, with momentum indicators tilting south.
On the weekly XRP price chart, that vertical breakout from late 2024 into 2025 looks impressive in hindsight. But markets don’t reward nostalgia. Since topping above $3, XRP price has been printing lower highs, slipping beneath key moving averages, and losing steam.
And the derivatives market? It’s not exactly stepping in to save the day.
Momentum Turns Against XRP Price
Take a look at the oscillators. MACD has crossed lower, histogram bars are bleeding red, and RSI has drifted toward the lower half of its range. That’s not capitulation, not yet, but it’s clear the euphoria phase has passed.
More importantly, the broader XRP price chart shows that the explosive upside move has been fully retraced in sentiment terms. The aggressive buyers that drove the spike have faded.
Which brings us to leverage.
Open Interest Sends a Message
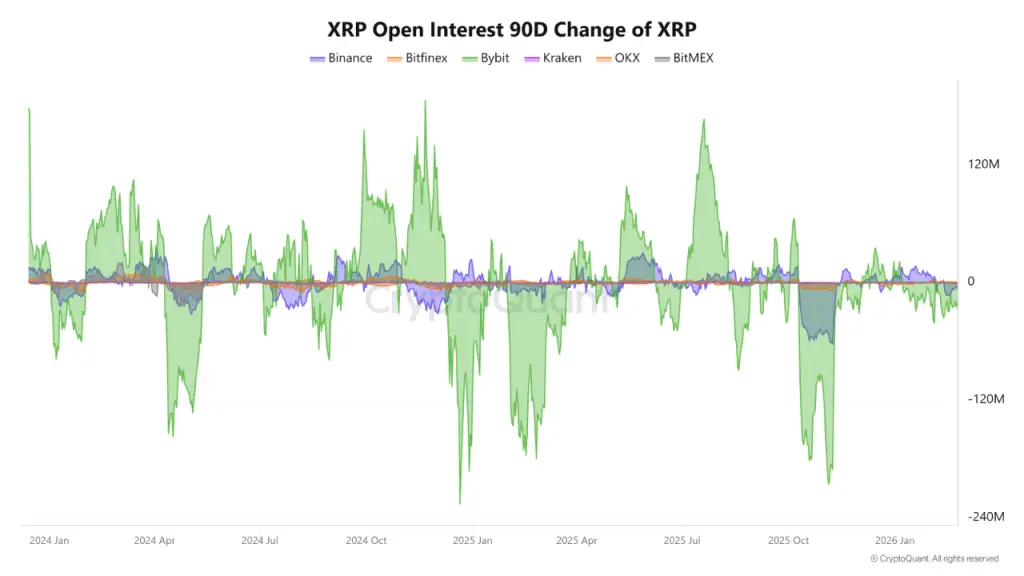 The 90-day change in XRP open interest across major exchanges shows something telling. Large spikes in positioning were followed by sharp contractions. On some platforms, swings reached deeply negative territory before stabilizing.
That kind of volatility in open interest suggests traders piled in aggressively during the rally and then pulled risk just as quickly. In other words, conviction didn’t stick.
When open interest compresses while price trends lower, it often means leverage is being flushed out rather than added. For any XRP price prediction to turn convincingly bullish again, sustained positioning growth would need to return.
Right now, that’s not happening.
XRP/USD at a Crossroads
 So where does that leave XRP/USD?
Technically, price is sitting near the $1.40–$1.45 area after rejecting from the $3 zone earlier in the cycle. The structure no longer screams breakout. It looks like digestion maybe even distribution.
Well, here’s the uncomfortable part. Big vertical rallies rarely drift sideways forever. They either re-accelerate with fresh momentum or correct deeper to reset sentiment completely.
Open interest volatility, weakening momentum, and fading upside pressure point toward caution.
That doesn’t guarantee a collapse. But it does mean the easy money phase is over.
For now, the XRP price is stuck proving it can stabilize before anyone seriously talks about new highs again.
Related Articles
Bitcoin price stalls at the $72,000 resistance level, losing a key support. Is $60,000 the dividing line between bulls and bears?
Reputed Analyst Shares 6 Stages of the Bitcoin Price Action Framework, Where is BTC Now?
Bitcoin Falls Below $66,000 as Hot PPI Data Fuels Rate Cut Uncertainty
Yesterday, the US Bitcoin spot ETF experienced a net outflow of $27.5 million.