Silver Price Manipulation? $1.6B Jane Street Position Raises Red Flags
The silver price was mostly calm yesterday, chopping in a tight $88–$90 range. Then analyst 0xNobler dropped a long post that frames that “calm” as the surface layer of a market dominated by paper flow, with one screenshot doing most of the heavy lifting: Jane Street showing up as the top holder in the iShares Silver Trust (SLV) with 20,672,537 shares (about 3.6% of shares outstanding in the image).
The claim is actually simple: when the biggest visible holder inside the biggest silver ETF is a speed-driven trading firm, silver’s moves stop looking “organic.”
What 0xNobler’s chart is trying to prove
The post uses two visuals:
- Holder table (top): Jane Street sits above other well-known names (BlackRock, Morgan Stanley, Bank of America, UBS, etc.). The point being made is not “institutions own SLV,” it’s “a hyper-active trading shop is the largest visible holder.”
- Intraday silver chart (bottom): multiple red-circled selloffs and sharp wicks. The arrows imply these aren’t random. The narrative is that SLV, futures, options, and related paper instruments can be pushed hard enough to create violent drops that shake out emotional traders.
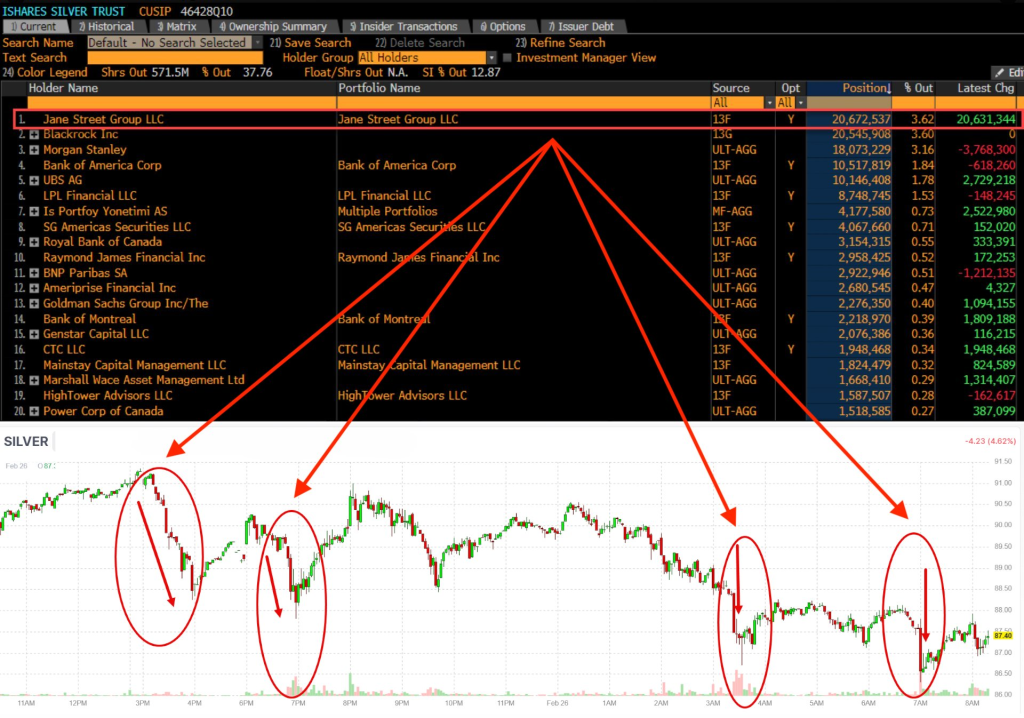
Source: X/@CryptoNobler
That framing plays into a long-running silver theme: paper and physical don’t always feel aligned, liquidity can vanish, and moves can get abrupt.
But one detail matters here: being the largest SLV shareholder is not the same thing as being “short silver.” SLV shares are long exposure by design. A firm can still run a bearish or “control the tape” strategy through hedges and linked instruments, but the screenshot itself does not prove a directional short. What it does show is scale and capability.
My take: big positions can explain the behavior, but they don’t prove “control”
Here’s the clean way to think about it.
1) A large SLV position doesn’t automatically mean manipulation.
Market-making and arbitrage desks often hold big ETF positions as inventory. They can be long SLV shares while short futures, long options, short calls, running spreads, or doing creation/redemption trades to capture tiny edges. That’s normal plumbing in ETFs and commodity products.
2) The “engineered move” argument is still plausible in structure terms.
Even if the intent is “just trading,” the effect can look engineered when:
- liquidity is thin at certain hours,
- stop clusters sit under obvious levels,
- paper volumes overwhelm spot behavior,
- a large player is active across multiple linked products.
The silver price is famous for big intraday air pockets. If a major participant leans into those moments, price can cascade fast, then mean-revert just as fast. That looks like “someone knew where the bodies were buried,” even if it’s simply flow exploitation.
3) The strongest part of 0xNobler’s post is the warning about behavior.
Whether the market is “rigged” or simply “brutal,” the practical lesson is the same: silver can punish overtrading. The chart circles highlight that pattern: sudden flushes, snap-backs, and long wicks that punish both late longs and late shorts.
So, does the screenshot prove Silver Price manipulation? No. It proves institutional-scale positioning inside SLV and raises a fair question: if the ETF wrapper is where many participants get exposure, how much of the price action is driven by paper flow and liquidity games?
Read also: The Critical Week Ahead Will Decide Whether Silver Price Pushes Above $130 or Revisits $70