Dogecoin's active address drops 78%: Will the price continue to be stuck below $0.09?
Dogecoin (DOGE) continues its downward streak amid escalating geopolitical tensions following Israel’s attack on Iran.
Failing to break through the resistance level of $0.106 triggered a strong sell-off, causing DOGE to close three consecutive sessions in the red. This weakening pressure quickly wiped out previous gains, pushing the price down sharply to $0.088.
Notably, the memecoin also broke through the 20-day EMA at $0.098 — a sign that the bearish momentum is clearly dominant. At the time of writing, DOGE is trading around $0.089, down 10.48%, and maintaining a bearish trend structure.
On-chain activity plunges 78%
DOGE’s weakening structure continues amid a sharp decline in on-chain activity and decreasing adoption. In fact, many investors have opted to sell off and completely withdraw from the market. According to data from Santiment, DOGE’s on-chain activity indicators have shown significant declines, reflecting a cooling of capital flow and market confidence.
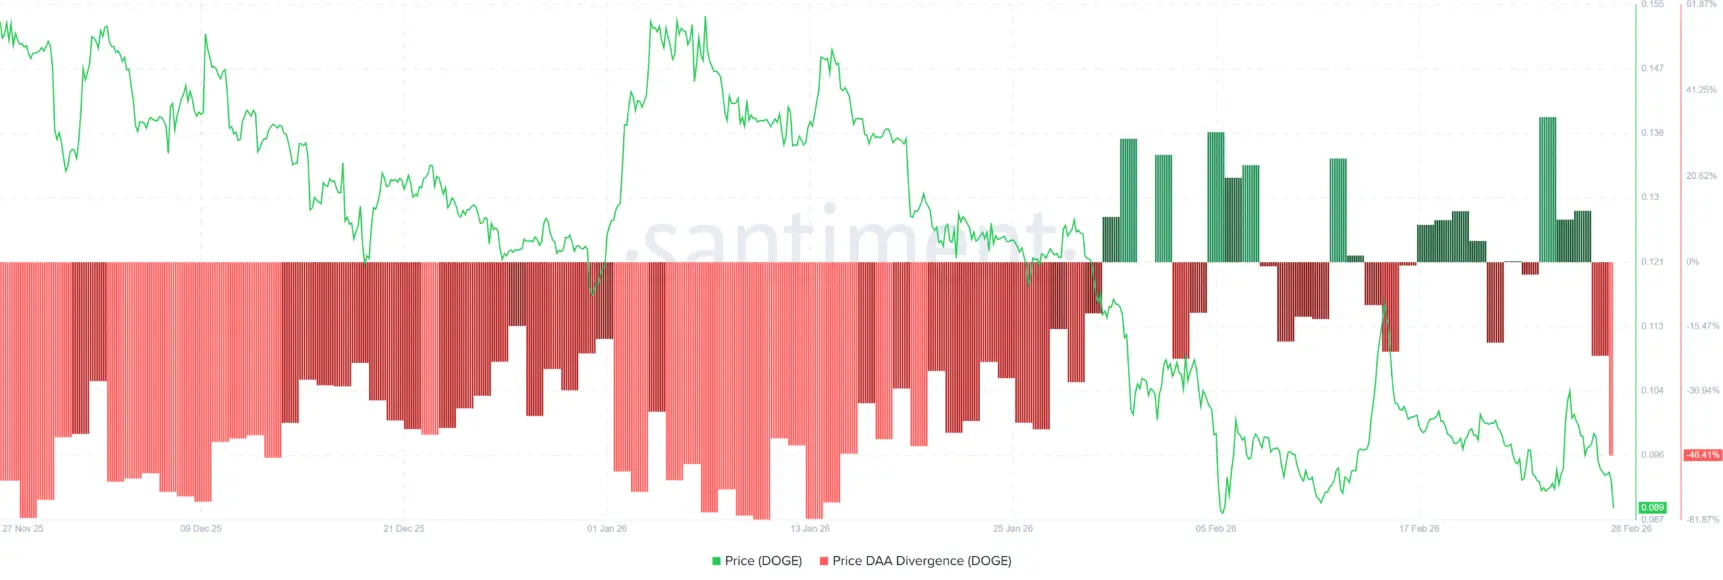 Source: Santiment## Dogecoin Price DAA Divergence Indicator
At the time of this article, the Price DAA Divergence indicator for this memecoin has plummeted to its lowest in two months, reaching -46%. Such deep negative values often indicate a significant weakening in demand and network usage, as the number of active users participating in transactions diminishes.
This suggests that Dogecoin is lacking sufficient natural buying pressure — a key factor needed to trigger sustainable price rallies. In fact, the number of daily active addresses has dropped by 78.34%, from 87,700 down to around 19,000 in February.
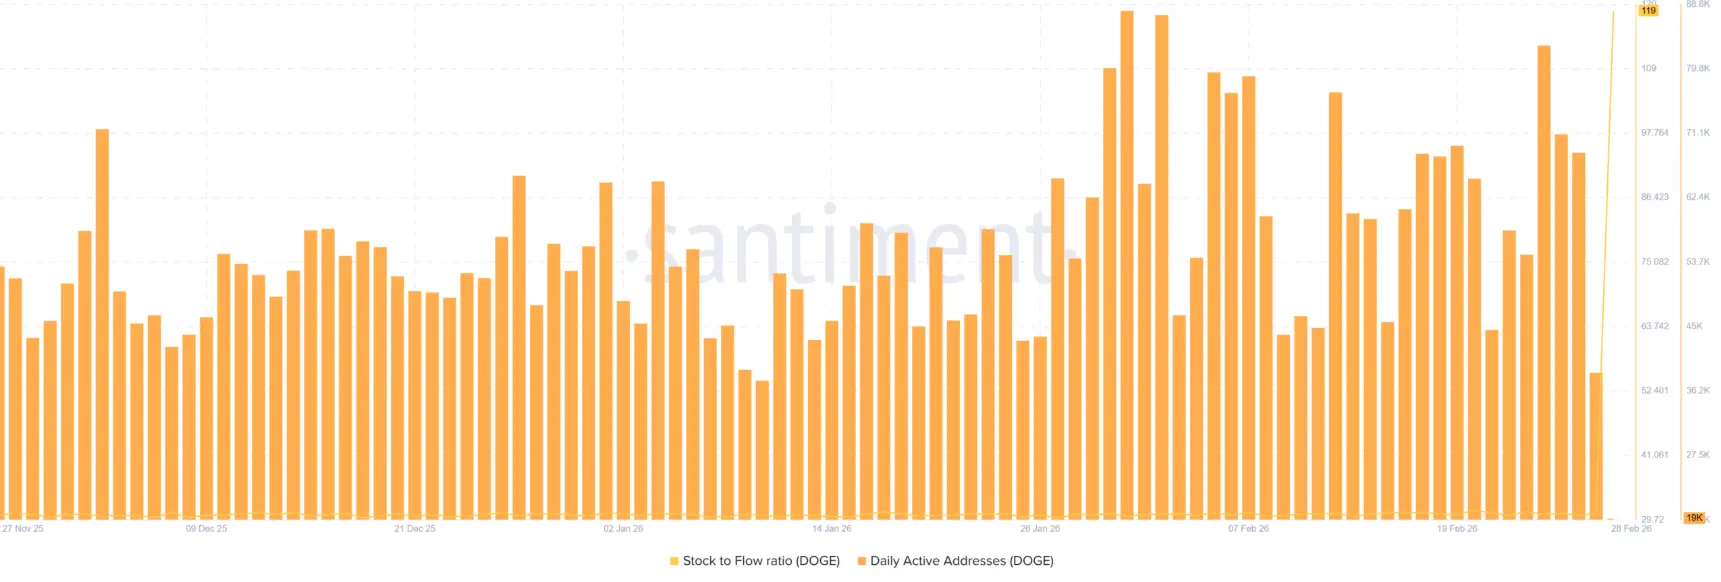 Source: Santiment The decline in active user groups reflects a cautious market sentiment, as most traders have closed their positions and are observing from the sidelines.
Sellers dominate completely
As geopolitical tensions escalate, widespread sell-offs have swept across the entire cryptocurrency market. Dogecoin investors are not exempt, as they collectively increase selling pressure.
In the derivatives market, this memecoin experienced a large capital outflow: $736 million withdrawn, surpassing the $659 million in inflows. As a result, Futures Netflow plunged by 418%, falling to -$77.39 million — a clear sign of aggressive and persistent selling activity.
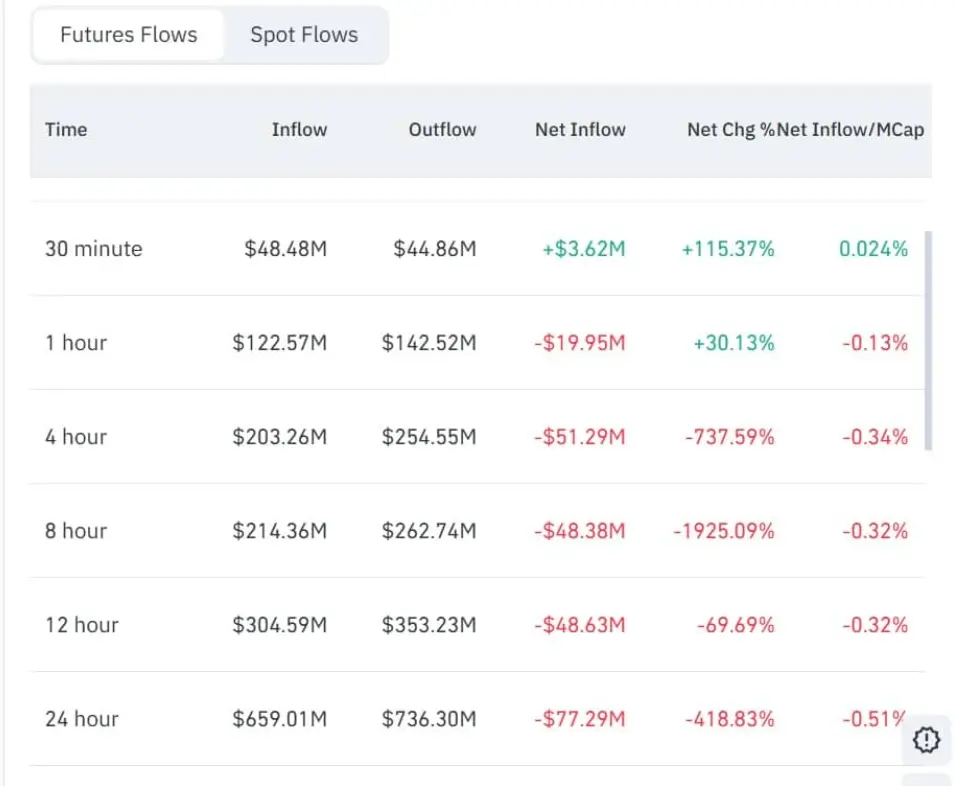 Source: CoinGlass When bears dominate the futures market, it indicates a growing risk-avoidance mentality, with investors fearing ongoing losses. Simultaneously, DOGE losing the $0.09 level has triggered a wave of liquidations.
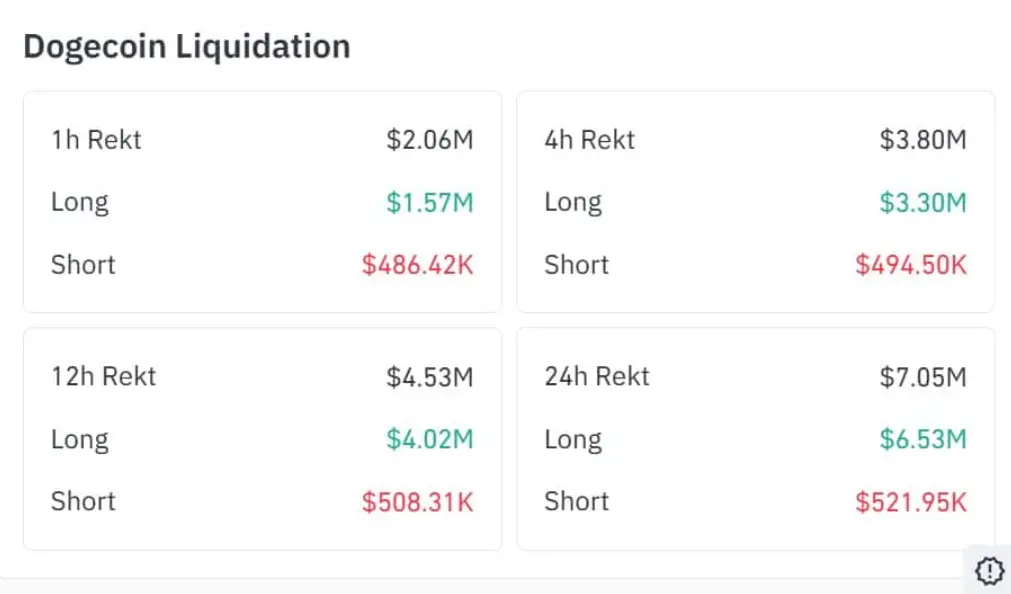
Specifically, DOGE saw a total of $6.5 million in long positions liquidated, with nearly $3.3 million in longs liquidated in the past four hours alone.
 Source: CoinGlass Not only in derivatives, but spot market selling pressure has also increased significantly. The sell volume reached $976.75 million, exceeding the $928 million buy volume, causing the Buy Delta to turn negative by $48 million — a clear sign that bears are in control.
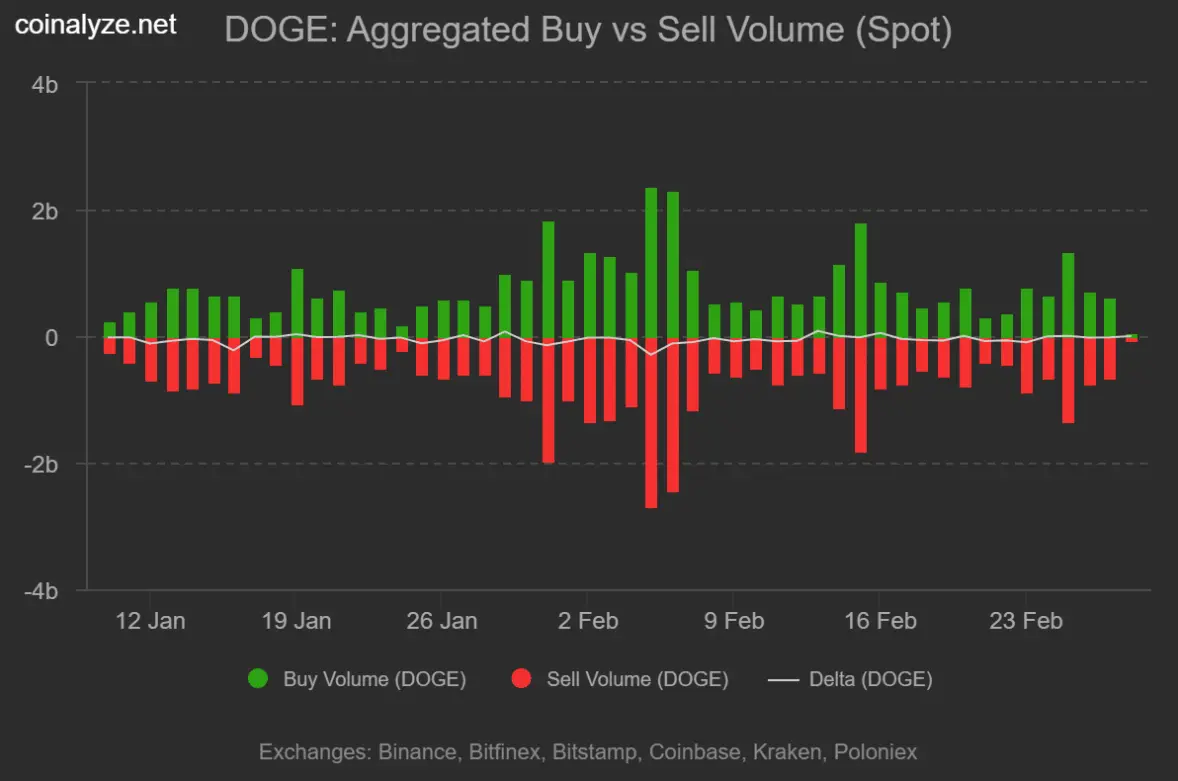 Source: Coinalyze Typically, when selling pressure dominates both derivatives and spot markets, the downtrend is amplified, pushing prices further lower.
What’s next for DOGE?
Dogecoin faces intense selling pressure as a sell-off wave engulfs the entire crypto market. Notably, even without clear negative catalysts, the memecoin’s fundamental factors are rapidly weakening, increasing the risk of a sharp decline.
This is reflected in the Directional Movement Index (DMI). At the time of writing, the -DI has surged to 54, while the +DI has fallen to 28 — a sign that the bears are fully in control. Momentum indicators confirm that the downward trend is very strong and shows no early signs of reversing.
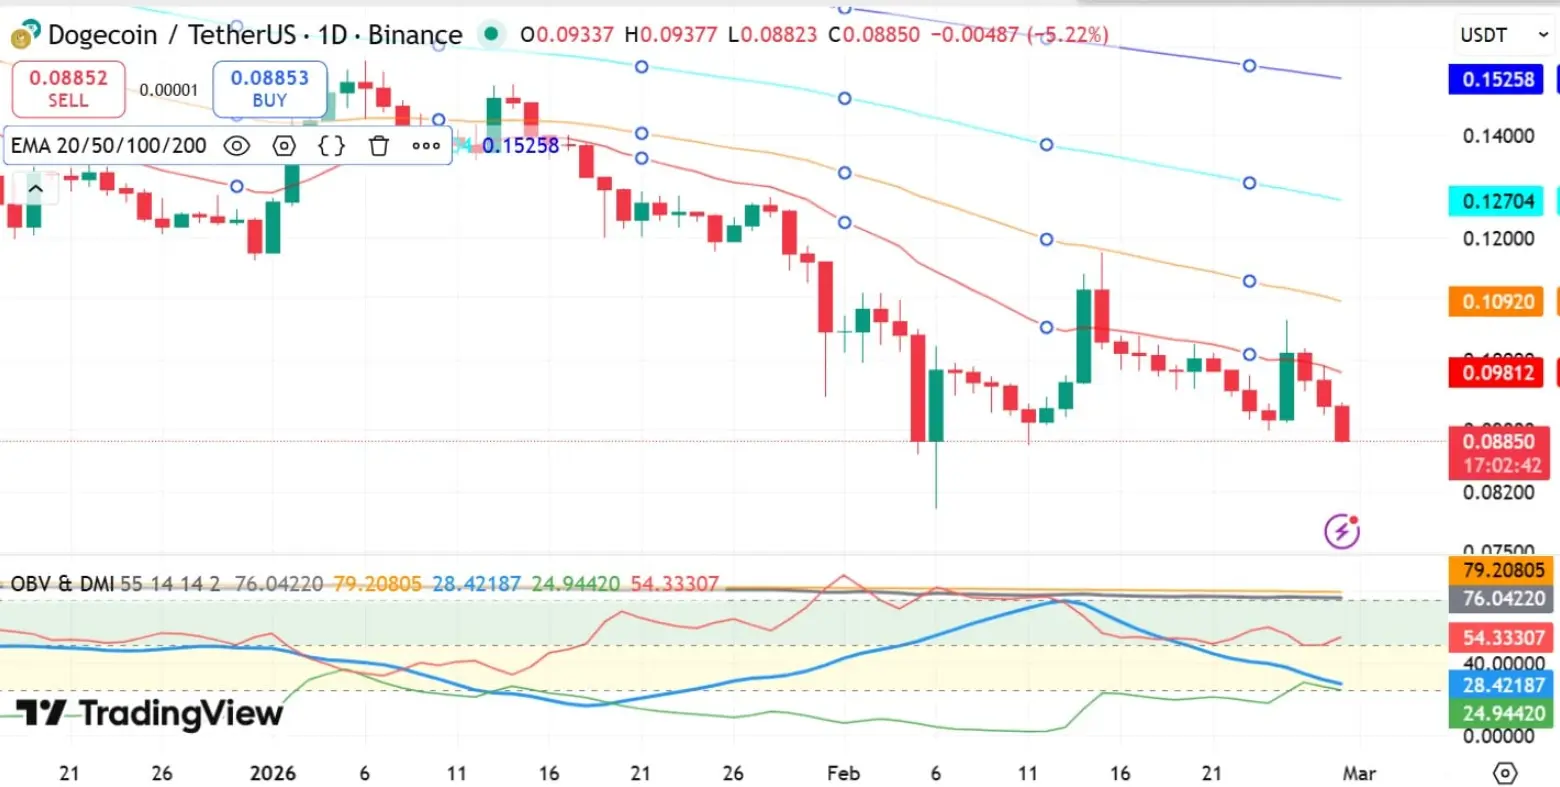 Source: TradingView If the selling pressure continues, DOGE is likely to fall back toward the support zone around $0.0800. To reverse the trend, the memecoin needs to regain momentum by closing above short-term moving averages, specifically the 20-day and 50-day EMAs.
Only then can DOGE attempt to reclaim and stabilize above the critical psychological level of $0.10.
Related Articles
Breakout Pushes $0.09656 DOGE Above Converging Trendlines as Price Trades Between Key Levels
Dogecoin (DOGE) to Bounce Back? This Key Emerging Fractal Chart Suggests So