Why did Bitcoin rise today? Showing resilience amid the Iran crisis, targeting $74,000.
As the US-Iran military conflict continues to escalate, Bitcoin has not followed the previous pattern of sharp declines caused by geopolitical shocks. Over the weekend, it remained relatively stable around $67,000, indicating that the market has already priced in the main geopolitical risks. Crypto trader BitBull interprets the three-day trend chart, stating that “resistance has turned into support,” and expects Bitcoin to rebound to $73,000–$74,000.
The Resilience of Bitcoin: Geopolitical Risks Have Been “Digest”
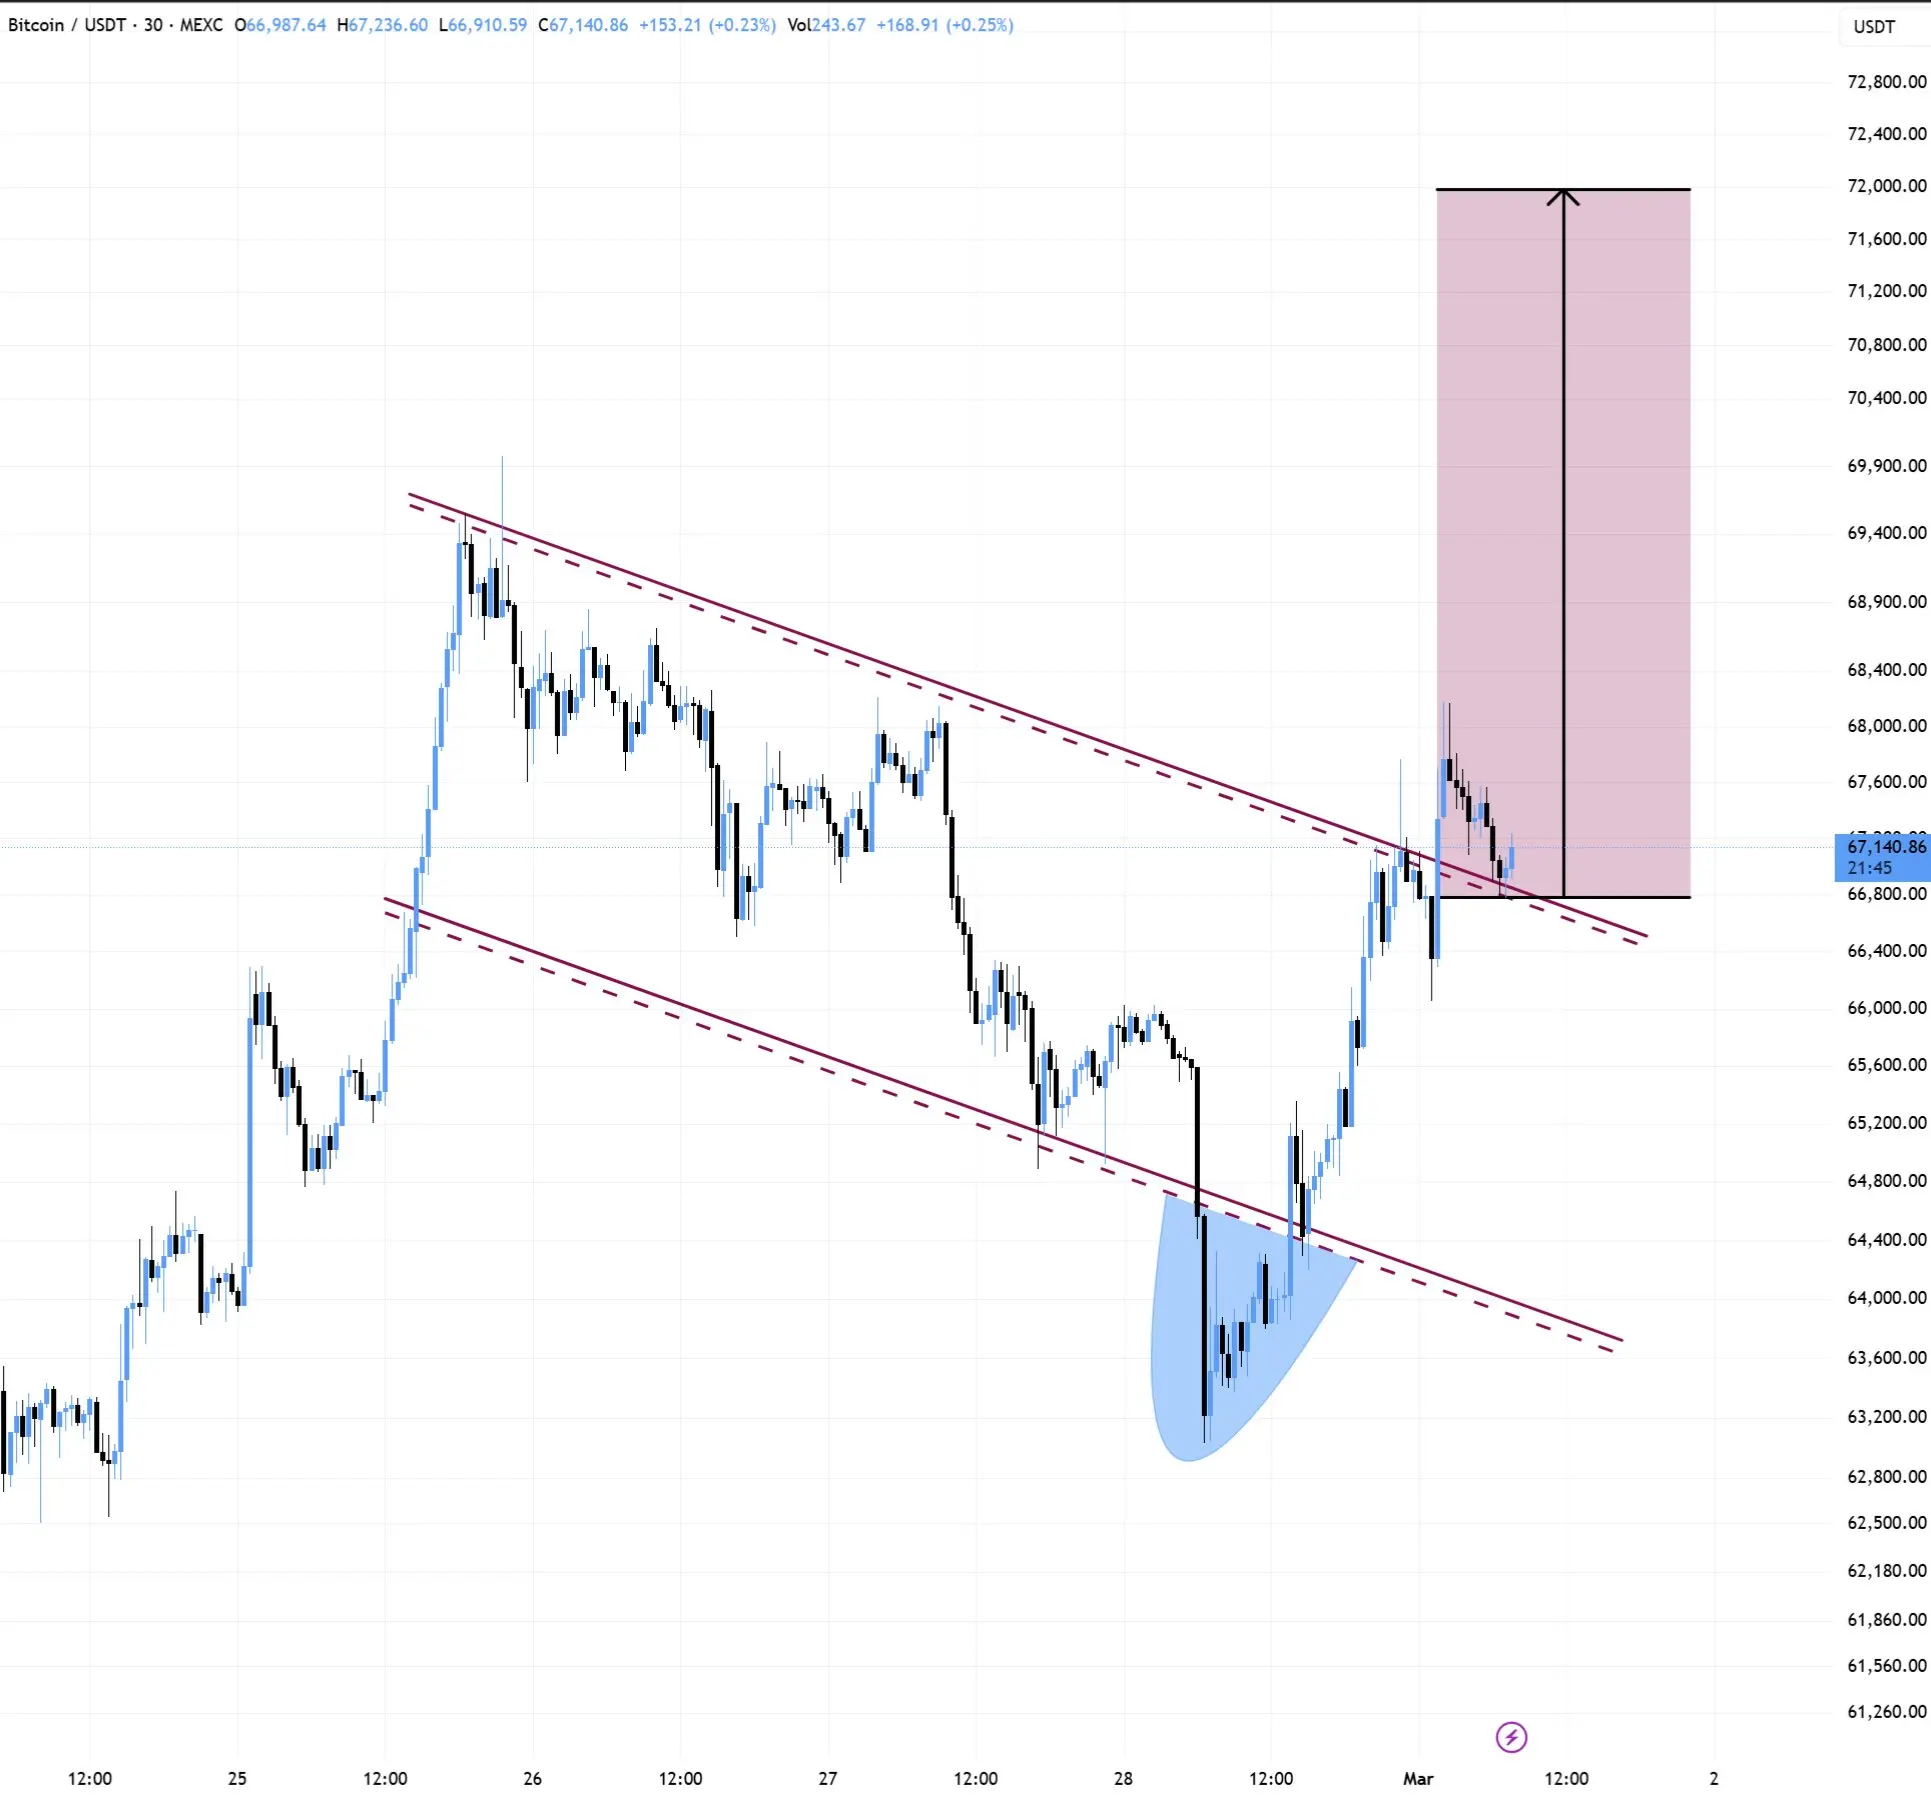
(Source: Trading View)
Over the weekend, President Trump confirmed in an exclusive interview with the Daily Mail that three US service members were killed during operations against Iran, and hinted that the conflict could last about four weeks. Iran issued a threat to block the Strait of Hormuz, causing US stock futures to fall by 0.65% over the weekend.
However, Bitcoin’s reaction was completely different. After a brief fluctuation, the crypto market quickly stabilized, with BTC/USD remaining within a local range and no breakthrough decline. Some market participants believe that the worst-case scenario of the Iran conflict has already been fully reflected in previous pricing, so the new developments did not trigger additional selling.
Three Main Reasons for Bitcoin’s Rise Today
Geopolitical Risks Already Digested: The market believes the main impact of the Iran conflict was priced in earlier, and weekend news did not cause additional panic.
Technical Support Turned Signal: BitBull points out that the previous resistance zone has turned into effective support, with a bullish three-day chart structure, targeting $73,000–$74,000.
21-Day Moving Average Breakout Expectation: Michaël van de Poppe states that if the 21-day simple moving average (around $67,627) can be broken, it will confirm a medium-term rebound, expected to occur between March and April.
Oil Prices and Inflation Impact: Where Is Bitcoin’s Biggest Downside Risk?
(Source: U.S. Bureau of Labor Statistics)
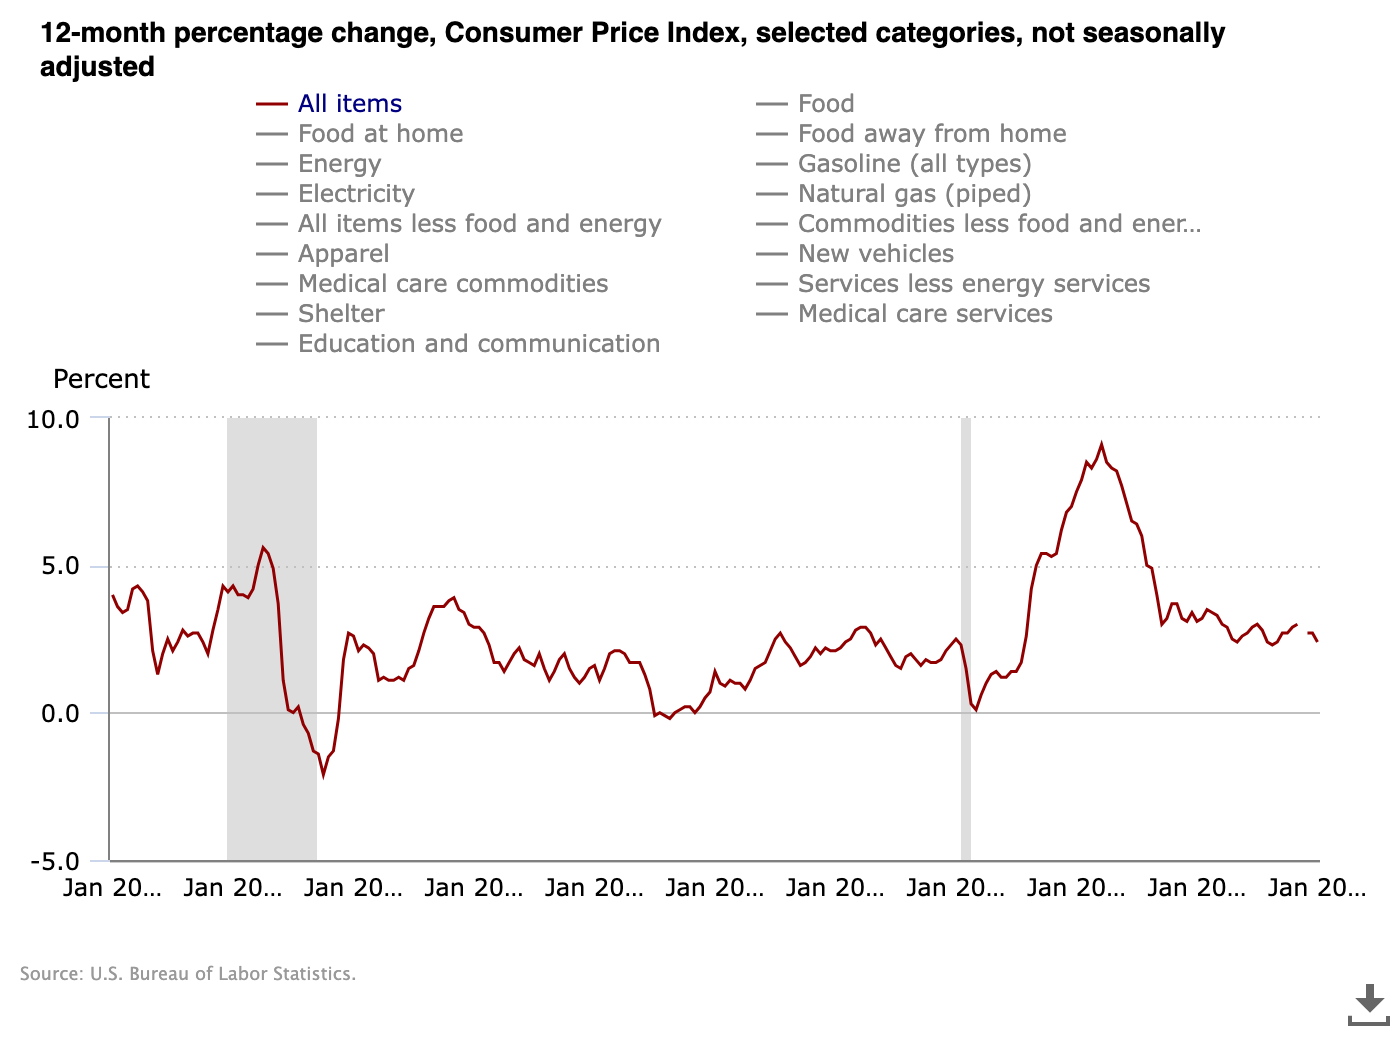
Although the short-term outlook is relatively optimistic, a key macro risk is brewing. If Iran actually blocks the Strait of Hormuz, global oil prices could surge dramatically. The resource trading platform Kobe Communications cites a JPMorgan research report, stating that a significant rise in oil prices could push US CPI to 5%.
The last time US CPI reached 5% was in March 2023, when the Federal Reserve was in an aggressive rate-hiking cycle, and radical tightening policies heavily suppressed risk assets. Recently, US inflation data has repeatedly exceeded expectations, especially the PPI data released on Friday, which was significantly higher than market estimates. If oil prices continue to climb, the Fed’s dovish expectations will be revised, and Bitcoin will face renewed macro pressure.
Additionally, the Chicago Mercantile Exchange (CME) Bitcoin futures have a downward unfilled gap at $65,880. If US stocks open under pressure tomorrow, this gap could become a short-term magnet for Bitcoin’s decline.
Frequently Asked Questions
Why did Bitcoin rise today?
The market generally believes that the main geopolitical risk from the Iran conflict has already been priced in, and weekend news did not trigger further selling. Several analysts see technical support turning signals, and the breakout of the 21-day moving average provides a basis for a bullish scenario from March to April.
What is Bitcoin’s short-term technical target?
BitBull expects Bitcoin to rebound from current support levels to $73,000–$74,000. The 21-day simple moving average (around $67,627) is a key technical threshold; a successful breakout would confirm the start of a medium-term bull trend.
What is the biggest risk of the Iran conflict for Bitcoin?
The greatest risk comes from rising oil prices fueling inflation expectations. If the Strait of Hormuz is blocked, causing oil prices to spike, US CPI could reach 5%, forcing the Fed to maintain a hawkish stance, which would suppress demand for risk assets like Bitcoin. Additionally, the CME futures gap at $65,880 remains a short-term downward magnet to watch.
Related Articles
MSTR declines for 8 consecutive months without fear! Michael Saylor announces additional Bitcoin purchases and a 11.5% annualized dividend increase
Hyperliquid hides 28.9 million shorts liquidated, bulls and bears battle at the $35 level
Analysis: Bitcoin technical indicators show a death cross, previously warning of the "final market decline" in earlier cycles.
Middle East Geopolitical Shock: Analyzing Hedging Capital Flows and BTC Pricing Logic Through Options Data
U.S.-Iran Conflict » Analysts Say Bitcoin Bottoming Out, Market Focuses on Oil and U.S. Inflation Changes
Shiba Inu Faces Pressure as 531B SHIB Flood Exchanges