Here’s Where Hedera (HBAR) Price is Headed In March

Hedera’s story is starting to look different. Over the past few days, the conversation around Hedera (HBAR) has shifted from pure speculation to real-world infrastructure use cases. The network was highlighted among high-upside altcoins if broader market momentum returns.
However, a senior U.S. Department of Transportation official patented a national road-use fee system built around Hedera’s hashgraph technology. That’s not typical crypto chatter, that’s institutional-grade direction.
Technically, HBAR has also been showing relative stability versus Bitcoin. While BTC experienced sharp swings, the HBAR price has been consolidating and forming a base. With price currently around $0.09716, traders are watching for a potential March breakout.
- Here’s What The Hedera Chart Is Showing
- What the Indicators Are Showing
- March Price Targets for HBAR
Here’s What The Hedera Chart Is Showing
We had a look at the 4-hour HBAR chart, and the broader structure is still corrective, but something has changed.
The HBAR price topped near the $0.21 region months ago and has been in a steady decline since, printing lower highs consistently. However, the recent structure shows stabilization around the $0.07–$0.09 zone. That area acted as a firm support in early February and has held through multiple retests.
Price is now consolidating just under the $0.10 level. That psychological barrier is acting as short-term resistance. Every attempt above it has seen modest rejection, but sellers are no longer aggressively pushing price lower.
The structure right now looks like compression. Volatility has decreased. That often precedes expansion, the only question is direction.
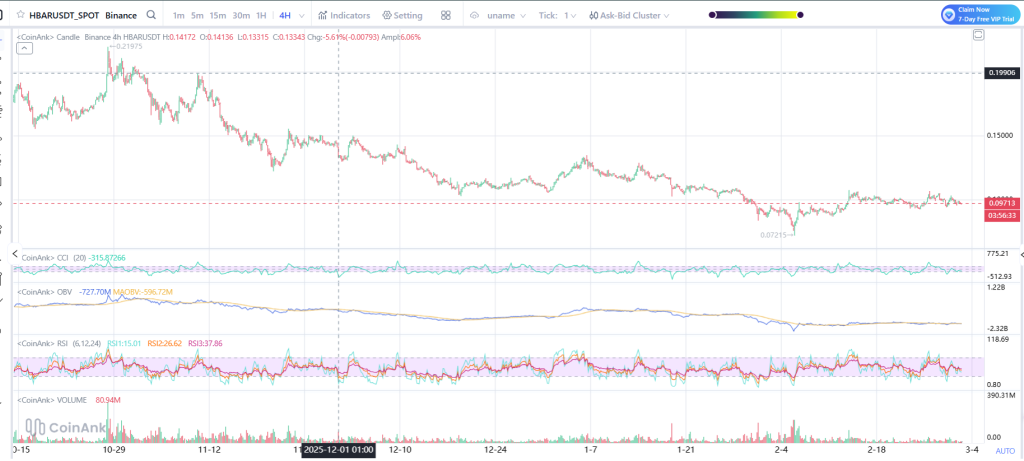
Source: Coinank
What the Indicators Are Showing
CCI is fluctuating near oversold territory but not deeply extended. That reflects consolidation rather than capitulation.
On-Balance Volume has flattened after a prolonged decline. That suggests selling pressure is cooling. It doesn’t confirm strong accumulation yet, but it shows distribution is slowing.
RSI sits near the mid-to-low 40s range. That signals weak momentum but not exhaustion. There is room for upside expansion if buyers step in.
Volume remains moderate. For a decisive move, we would need a clear pickup in participation.
Overall, indicators suggest HBAR is building a base, not breaking down.
_****IRAN Is About to Make The Stock Market Go Insane**
March Price Targets for HBAR
With HBAR trading near $0.09716, the key levels are clearly defined.
If the Hedera price breaks and holds above $0.10, the first upside target sits near $0.12–$0.13, which aligns with prior breakdown structure from January. A stronger push could extend toward $0.15, marking the next major resistance zone.
If broader crypto momentum returns and capital rotates into infrastructure-focused altcoins, a March extension toward $0.18–$0.20 becomes possible. That area aligns with the previous major distribution range.
On the downside, failure to hold $0.09 would expose the $0.072–$0.075 support region again. A breakdown below that shifts the structure back into bearish continuation mode.
Right now, the HBAR price is not trending aggressively, it is compressing. March will likely be defined by whether $0.10 flips into support. If it does, the recovery move could accelerate quickly.
Related Articles
BTC short-term decline of 0.81%: Futures long liquidation wave triggers passive selling and liquidity resonance, intensifying volatility
Breakout Pushes $0.09656 DOGE Above Converging Trendlines as Price Trades Between Key Levels
SOL Slides 11% to $78 After $90 Rejection — Is $76 Support Next?
Geopolitical Fears Drive Crypto Community Chatter to a New Peak
ETH short-term increase of 1.01%: ETF capital net inflow and ecological upgrade expectations resonate to drive a rebound
PEPE Slides Within Tight 24H Range — Will Momentum Hold as $0.053891 Caps Gains?