Stellar (XLM) faces the risk of a deep correction as derivative data signals a negative outlook
Stellar (XLM) continues to decline in the red, falling below the $0.16 mark as of Tuesday, despite a brief recovery attempt in the previous session. The rebound appears fragile as indicators from the derivatives market weaken across the board, reflecting increasing cautious sentiment. In this context, technical signals also remain negative, even leaning toward a deeper correction in the coming days if buying pressure does not improve soon.
Derivatives data indicates bearish sentiment
Derivatives data is signaling a negative outlook for Stellar. According to CoinGlass, the funding rate turned negative on Monday and currently stands at -0.021% on Tuesday, approaching levels seen during the sharp decline in mid-February. A negative funding rate means short sellers pay long buyers, indicating prevailing bearish sentiment toward XLM.
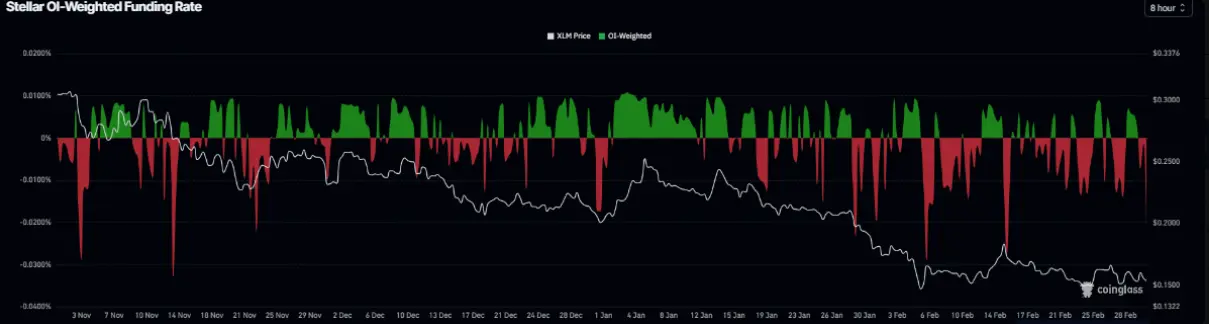 XLM funding rate chart | Source: CoinGlass
Additionally, the long/short ratio for XLM dropped to 0.79 on Tuesday, nearing its lowest in over a month. When this ratio is below 1, it suggests most traders are leaning toward further price weakness, increasing short-term downward pressure.
XLM funding rate chart | Source: CoinGlass
Additionally, the long/short ratio for XLM dropped to 0.79 on Tuesday, nearing its lowest in over a month. When this ratio is below 1, it suggests most traders are leaning toward further price weakness, increasing short-term downward pressure.
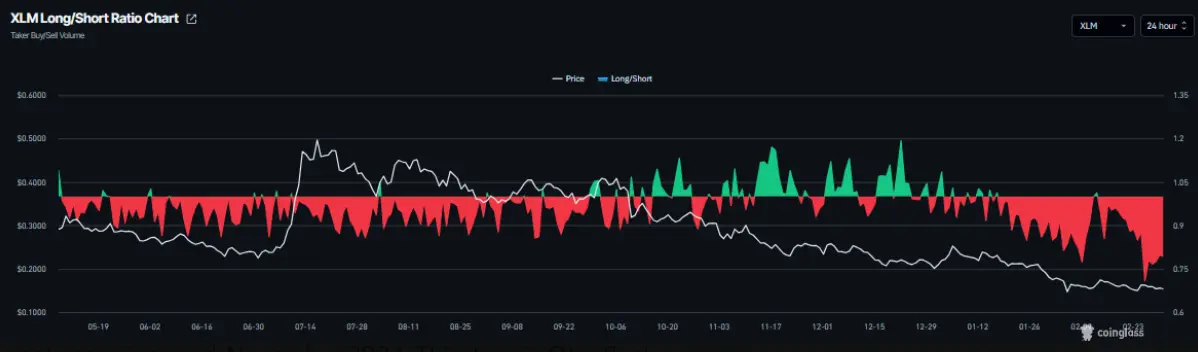 XLM long/short ratio chart | Source: Coinglass
In the futures market, Stellar’s open interest (OI) has shrunk to $84.87 million. OI has been steadily declining since early January and is now at its lowest since mid-November 2024. This downward trend indicates more cautious market participation, reinforcing the short-term negative outlook.
XLM long/short ratio chart | Source: Coinglass
In the futures market, Stellar’s open interest (OI) has shrunk to $84.87 million. OI has been steadily declining since early January and is now at its lowest since mid-November 2024. This downward trend indicates more cautious market participation, reinforcing the short-term negative outlook.
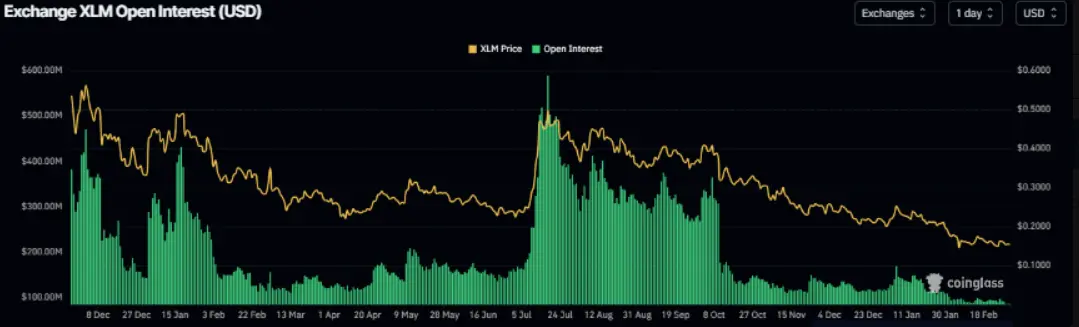 Stellar open interest | Source: Coinglass
Stellar Price Forecast: Overall structure remains bearish
At the time of writing, Stellar (XLM) is trading around $0.15, but short-term technical outlook remains clearly negative. The price is well below the 50-day and 100-day exponential moving averages (EMA), both of which are trending downward, indicating the prevailing downtrend has not yet shown signs of reversal.
XLM’s retreat below the broken downtrend zone around $0.17 reinforces the view that bears still control rebounds. Instead of confirming a sustainable reversal, the market is showing technical recoveries that are quickly absorbed by selling pressure. Momentum indicators also support this scenario: the daily RSI has weakened to around 40 after a brief rally, reflecting insufficient buying strength to change the trend. Meanwhile, MACD remains above zero but the positive histogram is shrinking, signaling weakening bullish momentum amid a still bearish overall structure.
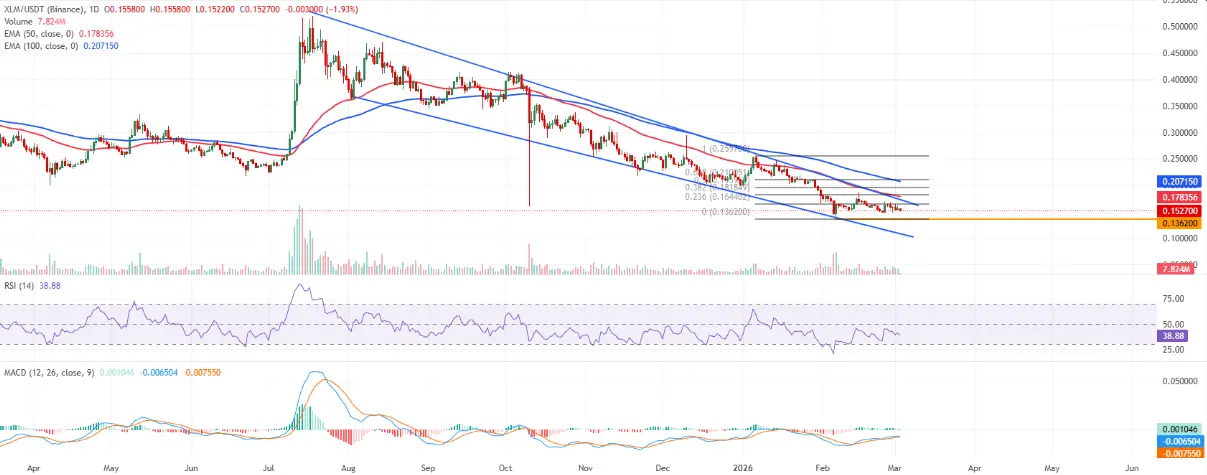 Daily XLM/USDT chart | Source: TradingView
On the resistance side, the $0.16 zone acts as the nearest barrier, coinciding with short-term peaks and a previously broken trendline. Further above, the 23.6% Fibonacci retracement level of the decline from $0.25 to $0.13 also hovers around $0.16, adding to the resistance pressure. If buying momentum is strong enough to break through, the $0.18 level—corresponding to the 38.2% Fibonacci retracement and the most recent reaction high—will be the next significant hurdle.
Daily XLM/USDT chart | Source: TradingView
On the resistance side, the $0.16 zone acts as the nearest barrier, coinciding with short-term peaks and a previously broken trendline. Further above, the 23.6% Fibonacci retracement level of the decline from $0.25 to $0.13 also hovers around $0.16, adding to the resistance pressure. If buying momentum is strong enough to break through, the $0.18 level—corresponding to the 38.2% Fibonacci retracement and the most recent reaction high—will be the next significant hurdle.
Conversely, $0.15 is currently a key short-term support level. A decisive break below this could open the door to a retest of the recent lows near $0.14, or even deeper toward the $0.14–0.13 zone—the Fibonacci origin point. As long as XLM remains suppressed below the resistance band of $0.16–0.18, rebounds are likely to be technical in nature and face substantial selling pressure, with the risk of testing lower support levels still present.