Ripple’s price shows bearish signs; if the current key support level breaks – the drop could escalate even faster.
Technical Analysis
By Edris
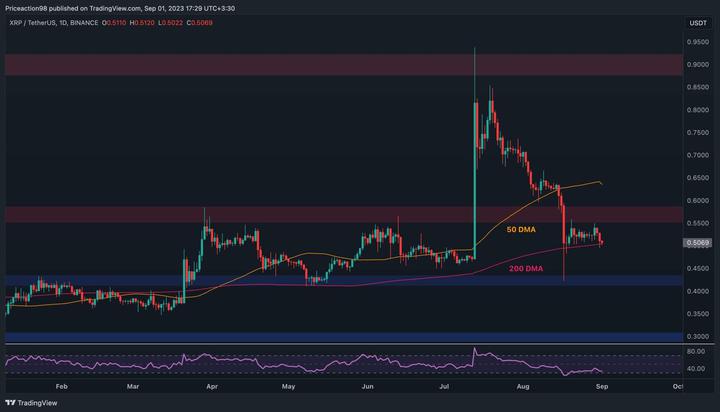
The USDT Paired Chart
On the USDT paired chart, the price has held above the 200-day moving average, around the $0.5 mark, over the past few weeks. However, the price is currently testing the 200-day moving average. If this moving average breaks down, the price will drop quickly towards the $0.43 level.
On the other hand, if the price rebounds from the 200-day MA, this could lead to a bullish move towards the $0.55 resistance zone. Yet, given the RSI indicator showing values below 50%, it is more likely that the bearish scenario will play out.
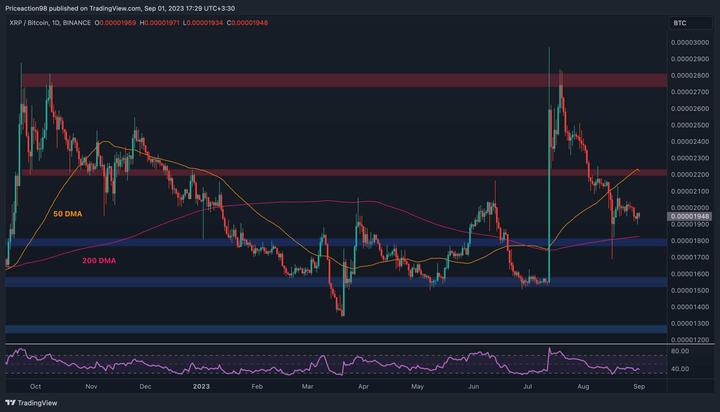
The BTC Paired Chart
Looking at the BTC paired chart, things are looking similar. XRP is trending down towards the 1800 SAT level, following the breakdown of the 2200 SAT level and the 50-day moving average around the 2100 SAT area. XRP’s bulls hope that the 200-day moving average, trending near the 1800 SAT mark, will prevent the price from dropping lower toward the 1500 SAT area and beyond. If XRP breaks below this support zone, the situation will worsen on the Bitcoin-paired chart.
Disclaimer: The information on this page may come from third parties and does not represent the views or opinions of Gate. The content displayed on this page is for reference only and does not constitute any financial, investment, or legal advice. Gate does not guarantee the accuracy or completeness of the information and shall not be liable for any losses arising from the use of this information. Virtual asset investments carry high risks and are subject to significant price volatility. You may lose all of your invested principal. Please fully understand the relevant risks and make prudent decisions based on your own financial situation and risk tolerance. For details, please refer to
Disclaimer.