The trading volume of tokenized gold has reached a record high amid escalating tensions between the US and Iran recently. According to reports, this figure has increased by 290% compared to the previous record. This indicates that asset tokenization could become one of the biggest trends driven by the CLARITY Act.
In this context, Solana (SOL) has emerged as a potential beneficiary of the explosive growth in asset tokenization. According to Coinphoton analysis, Solana’s fast network and robust blockchain infrastructure could help it capture a significant share of the growing tokenization market.
Furthermore, institutional investor interest in Solana is also increasing significantly. Strong ETF fund flows, developments in the payments sector, and positive expectations from the CLARITY Act have provided a solid foundation for long-term investors to place their trust in Solana.
However, despite promising long-term prospects, it is undeniable that the cryptocurrency market is currently facing a challenging downturn. The risk of deeper price declines remains for many assets in the market.
On-chain signals: Selling pressure is increasing on Solana
One of the clearest signs of bearish pressure is the Coin Days Destroyed (CDD) indicator. This metric measures the sudden movement of large amounts of long-held coins that have not been traded for a while.
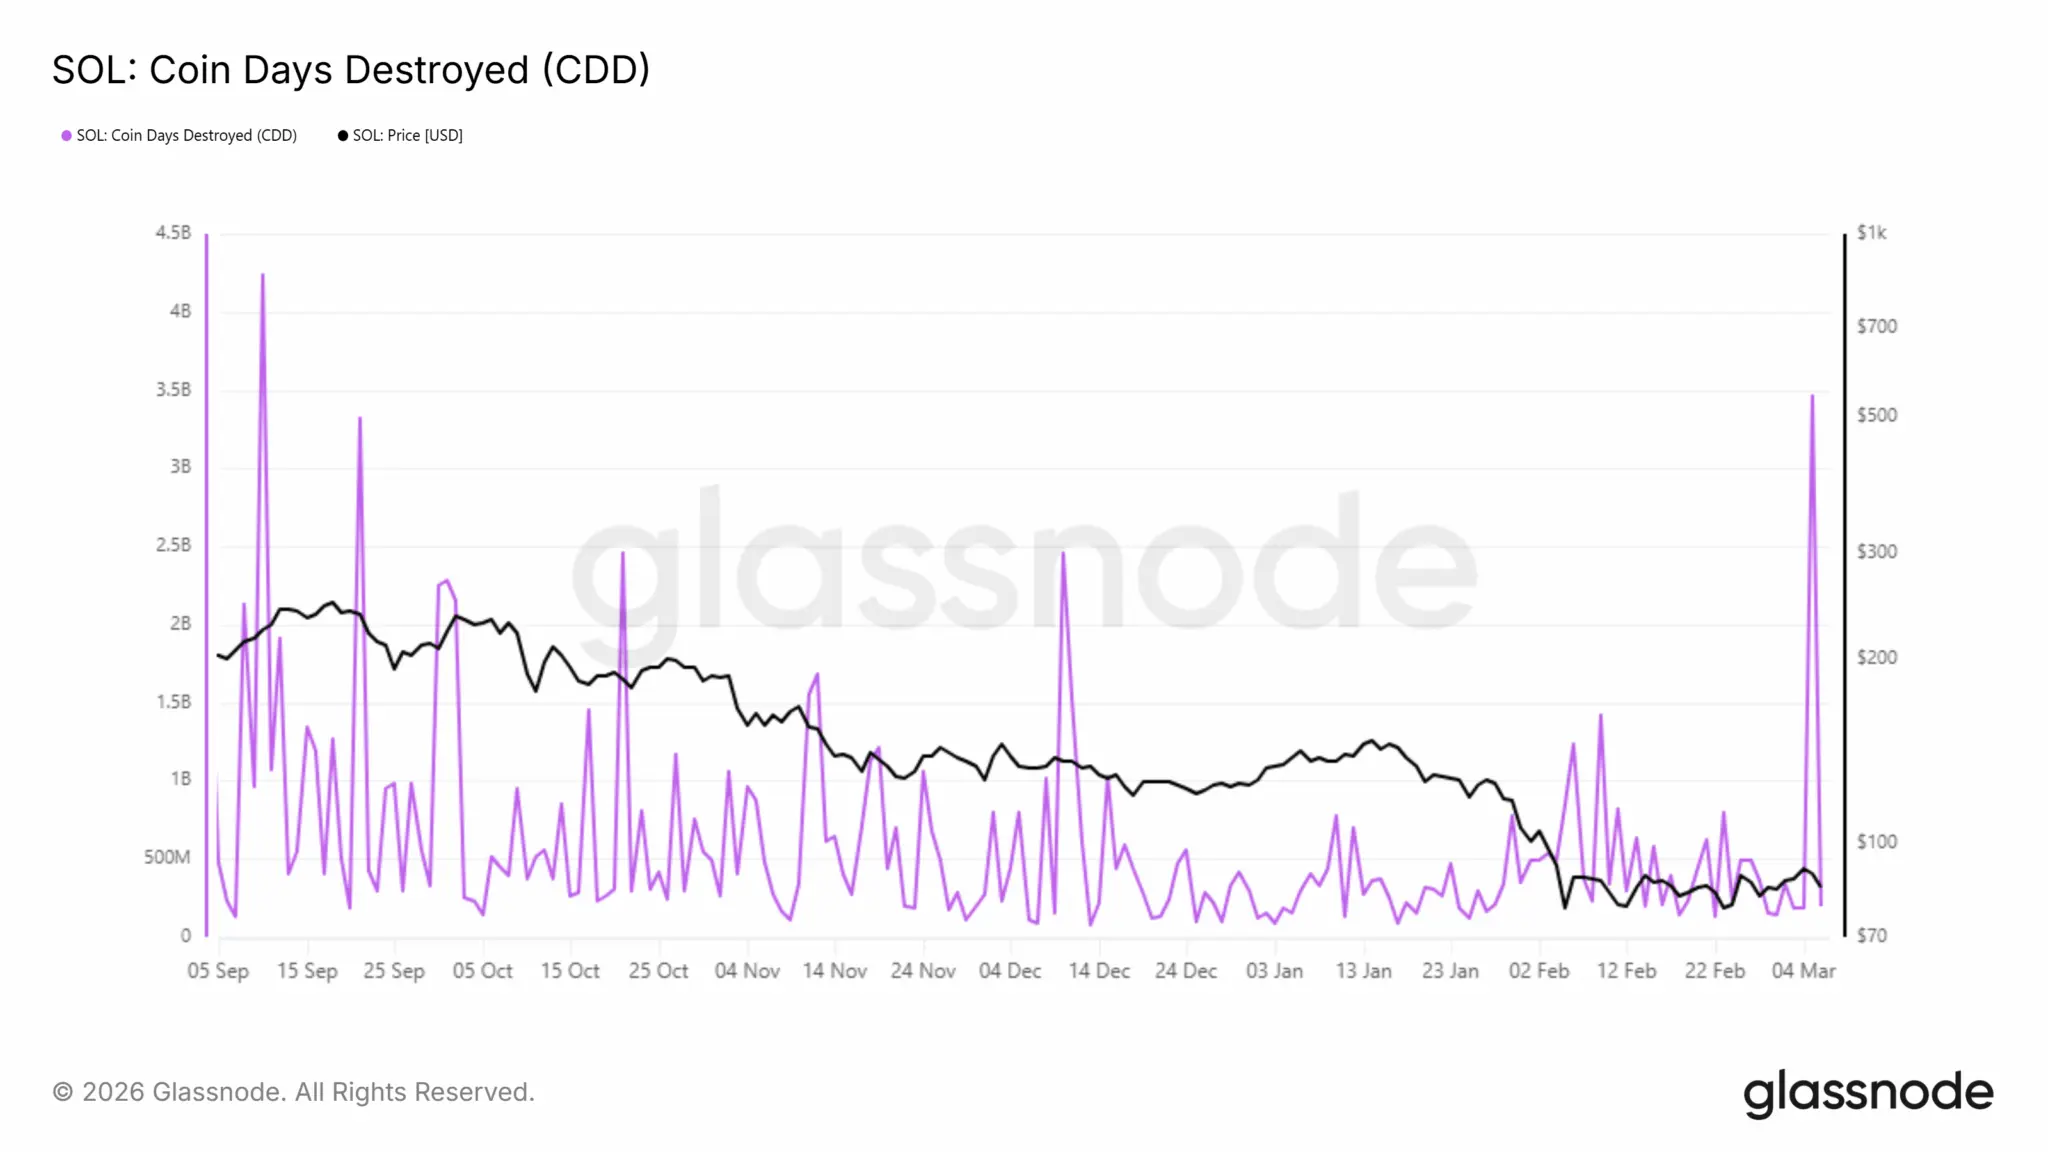 Source: Glassnode On March 5th, the CDD spiked sharply as SOL’s price approached the $90 resistance level.
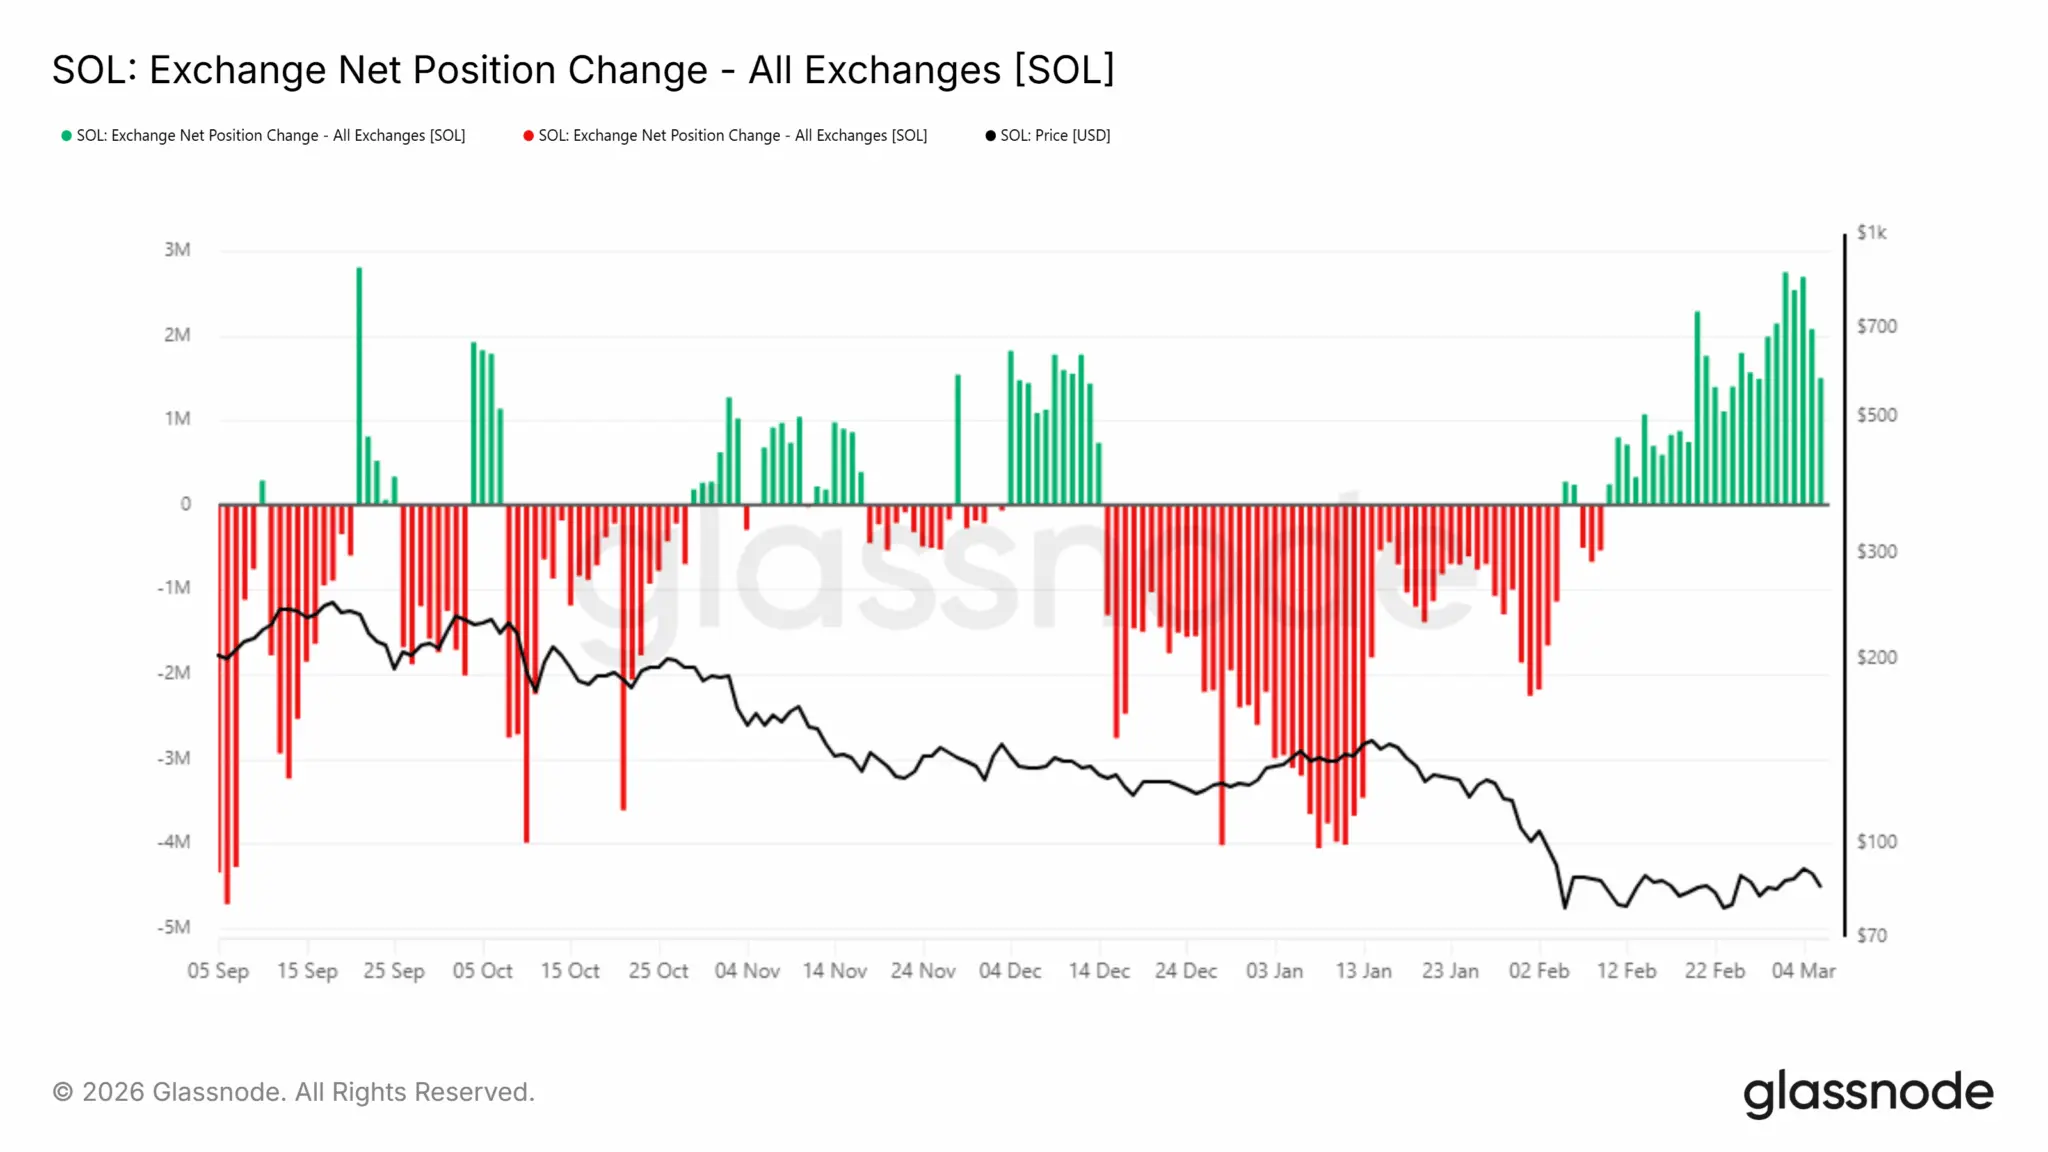 Source: Glassnode The increase in token movement activity is also accompanied by a significant inflow of funds into exchanges over the past month. Typically, when exchange inflows rise, it suggests that investors may be preparing to sell. The price drop below $100 at the end of January reinforced this trend.
Combined with the sudden spike in the CDD indicator, this signals a potential wave of selling pressure, urging SOL investors to exercise caution.
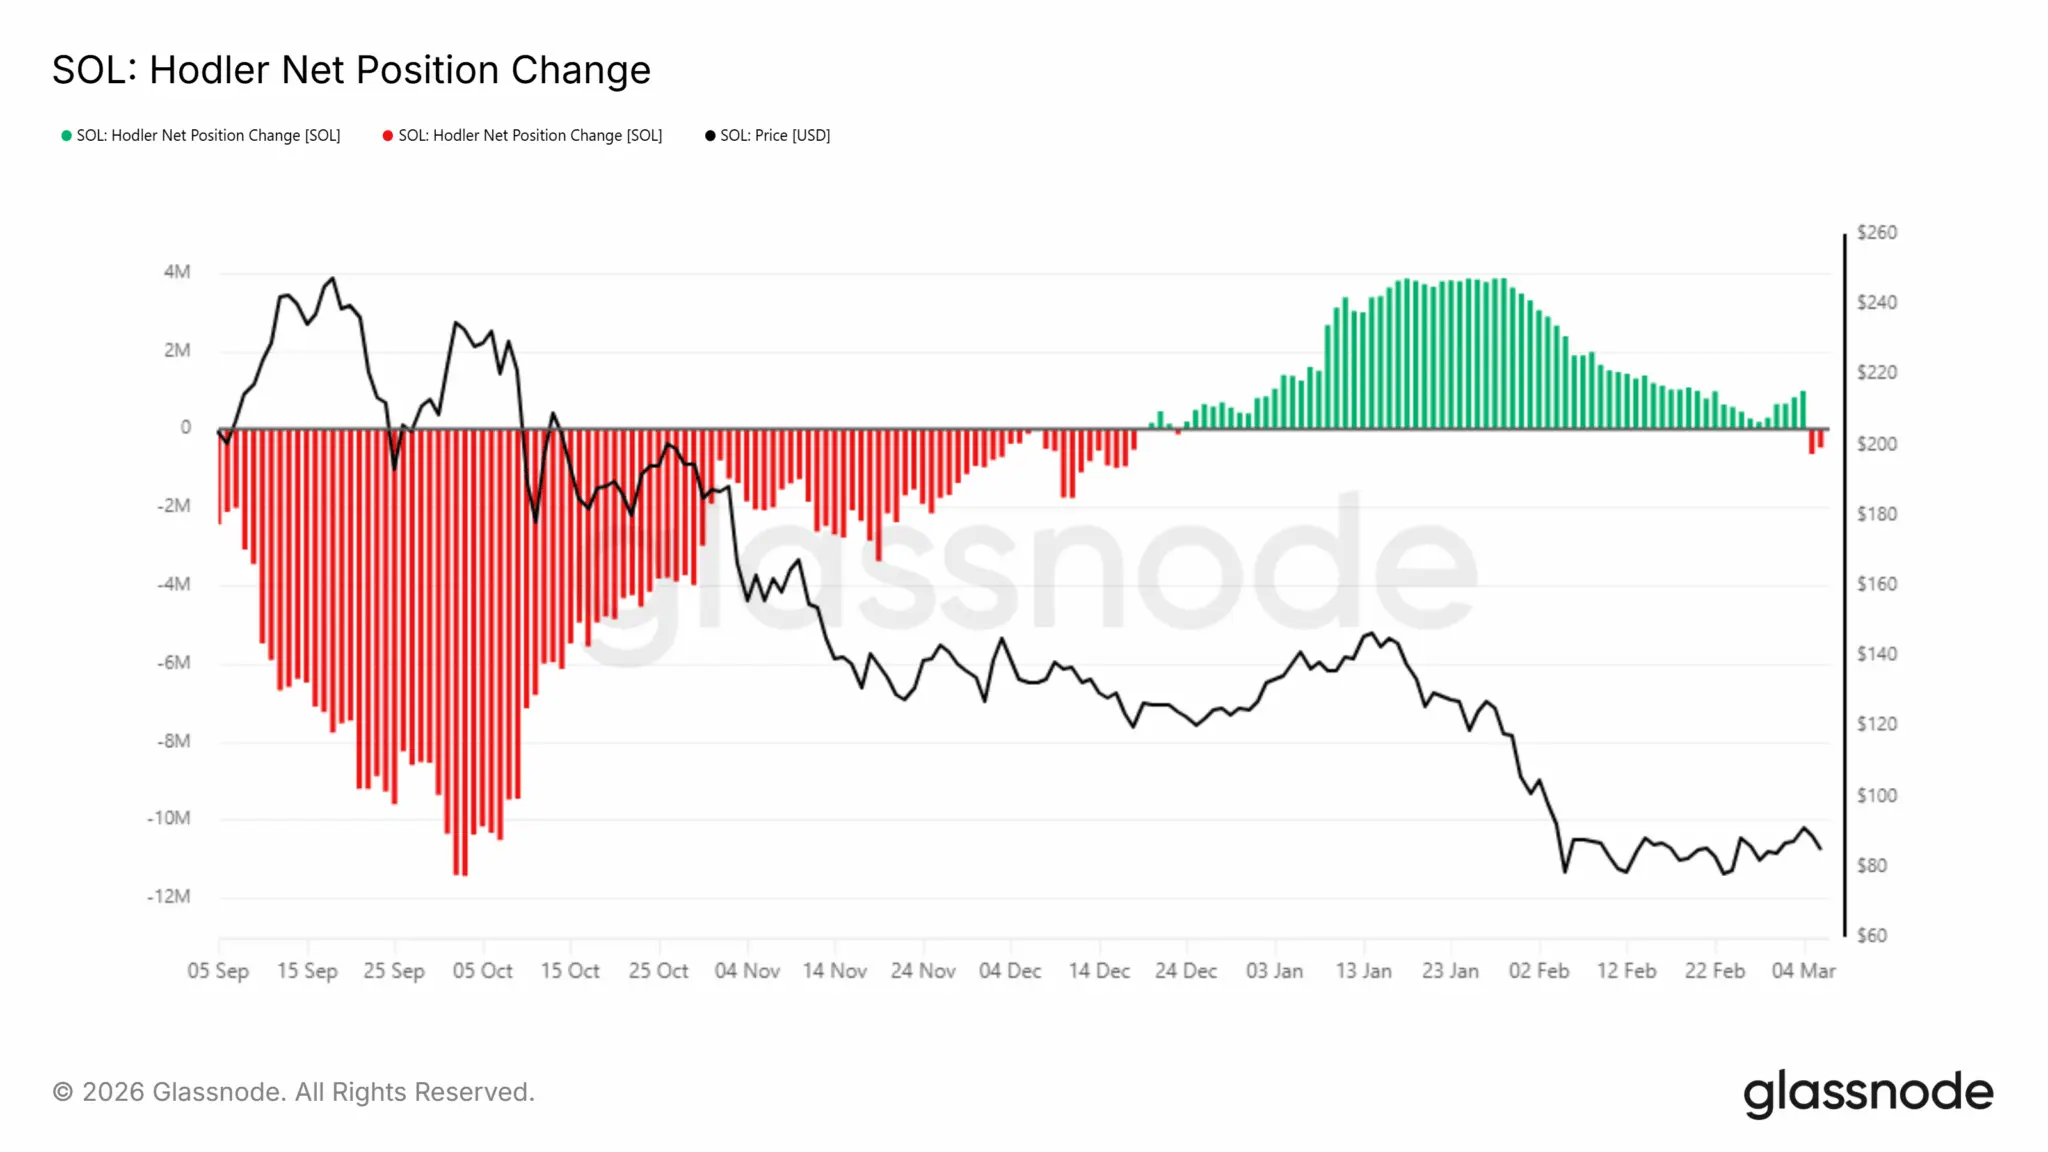 Source: Glassnode Additionally, the HODLer Net Position Change indicator, which tracks the behavior of long-term investors, is also sending notable signals. Since December, this indicator has shown continuous increases in holdings, represented by green bars on the histogram. However, in recent days, it has turned negative, indicating that HODLers are starting to sell their SOL. This is another sign reinforcing the current downward trend for Solana.
Short-term trend forecast
Based on the above factors, it appears unlikely that Solana will break above $100 in the near term. Instead, a more plausible scenario is that investors will capitalize on rallies to take profits, creating greater selling pressure in the market.
Disclaimer: The information on this page may come from third parties and does not represent the views or opinions of Gate. The content displayed on this page is for reference only and does not constitute any financial, investment, or legal advice. Gate does not guarantee the accuracy or completeness of the information and shall not be liable for any losses arising from the use of this information. Virtual asset investments carry high risks and are subject to significant price volatility. You may lose all of your invested principal. Please fully understand the relevant risks and make prudent decisions based on your own financial situation and risk tolerance. For details, please refer to
Disclaimer.