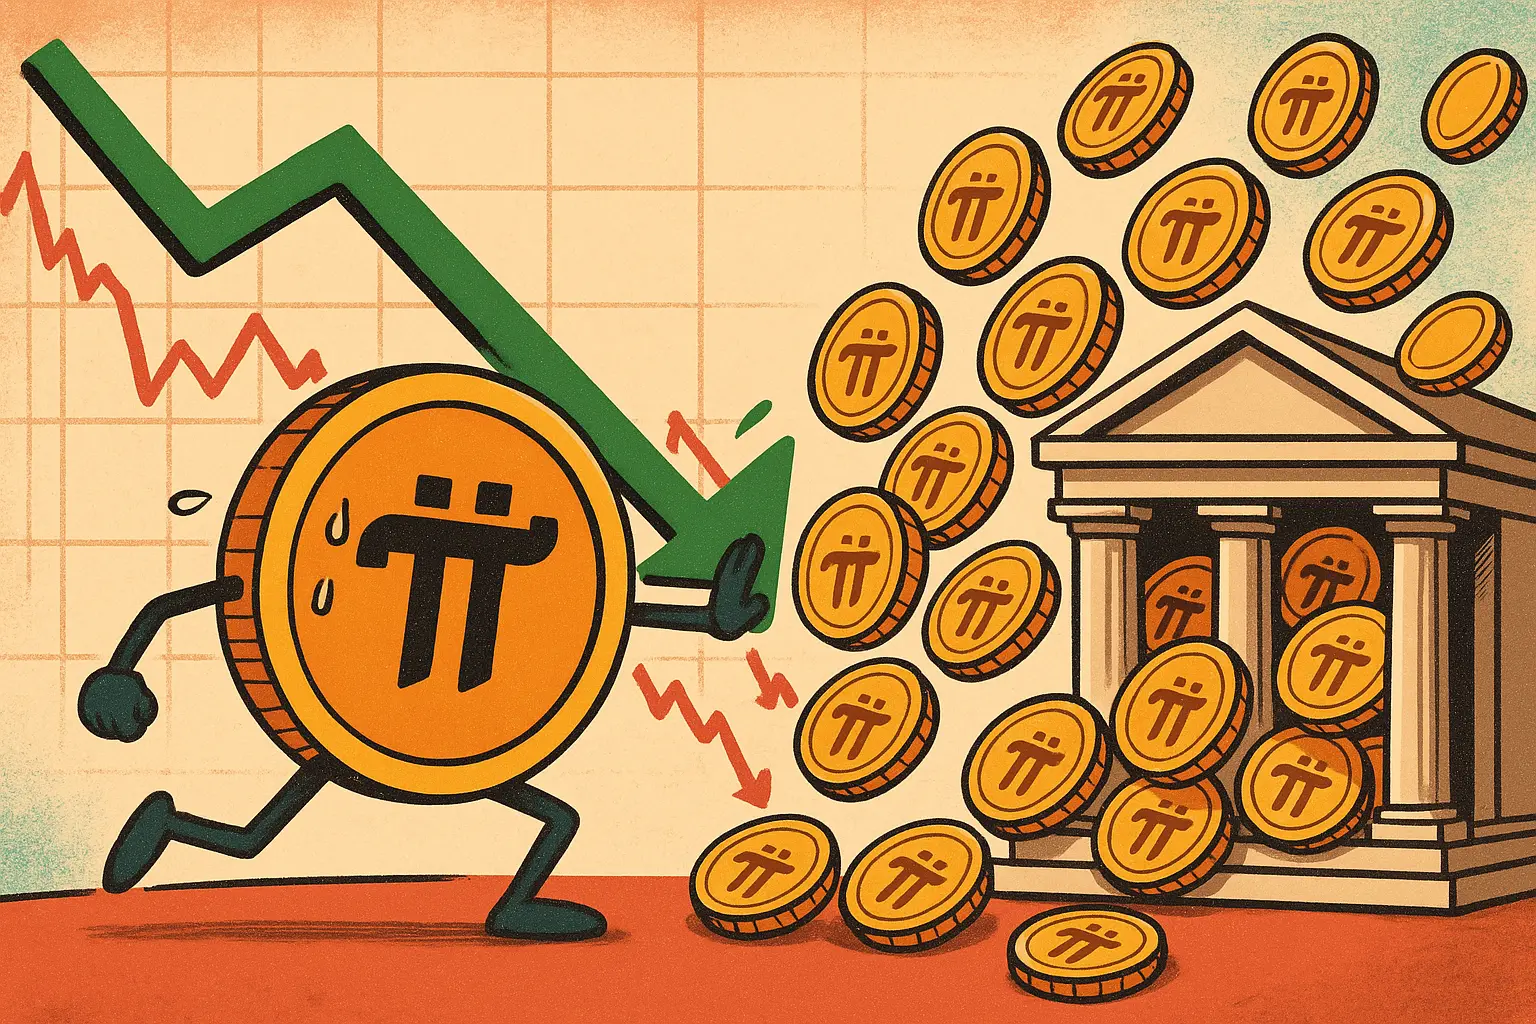
On March 11, Pi Network (PI) rose to $0.2310, with a cumulative increase of over 25% since March. However, Santiment data indicates a surge in market activity, with 3.91 million PI tokens flowing into centralized exchanges (CEX) in the past 24 hours, further up from 3.34 million the previous day. Both indicators suggest that profit-taking pressure is building.
Social Media Buzz and Technical Indicators: Double Support for Bullish Momentum

(Source: Santiment)
There is a direct positive correlation between Pi Network’s social media activity and its spot price. According to Santiment, social media discussion volume for PI surged to 21 on Monday, with mentions significantly increasing. The social media share among the top 100 cryptocurrencies is 0.012%. Although the absolute value is low, this indicator is rising, aligning with this month’s upward trend.
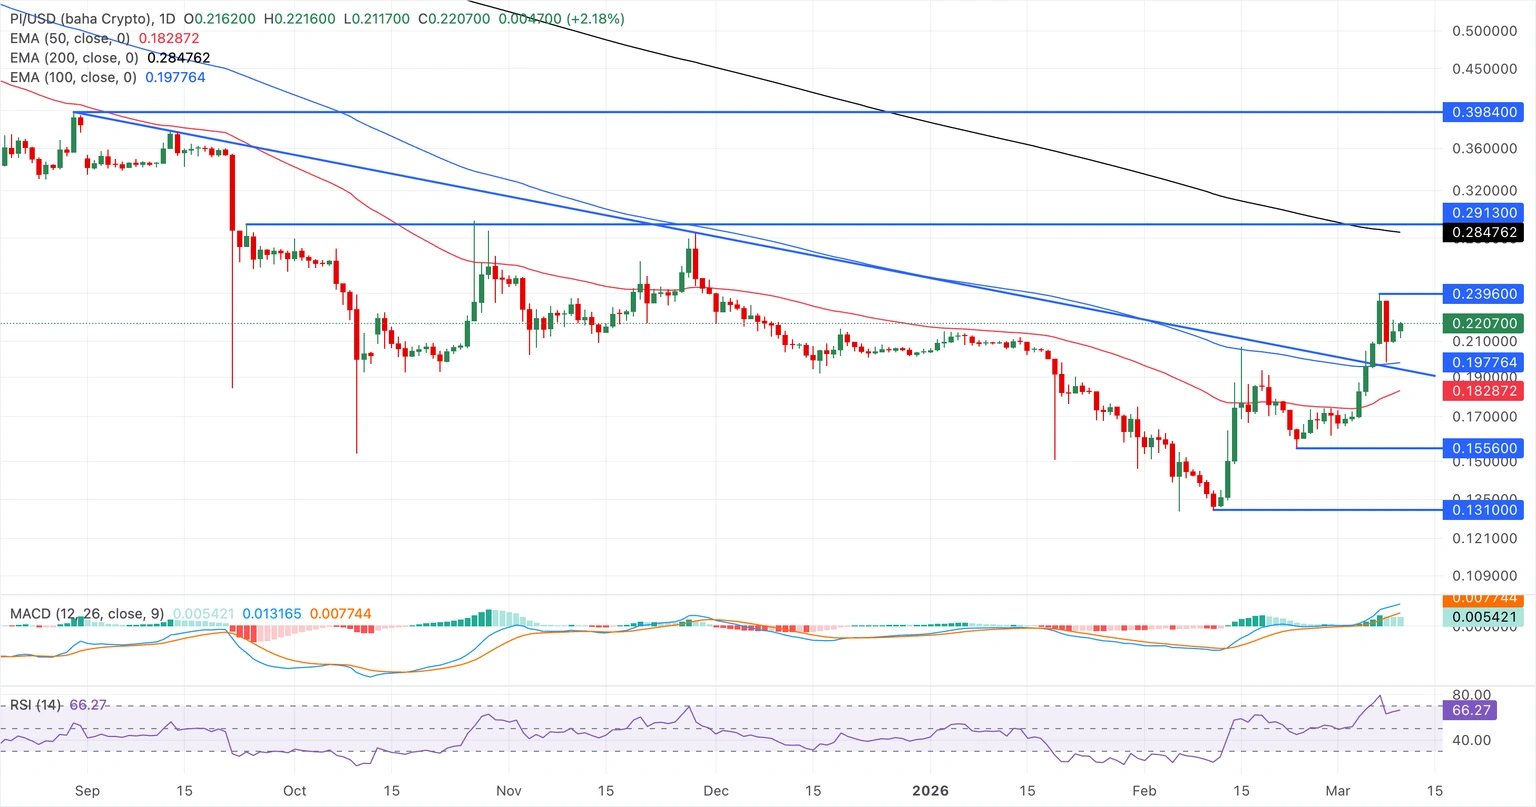
On the technical side, the daily RSI stands at 66, still rising after leaving the overbought zone on Sunday, indicating sustained buying pressure. The MACD remains above the signal line and zero, reflecting ongoing bullish momentum but with some weakening. Moving averages show the 50-day moving average approaching the 100-day moving average from below, potentially forming a golden cross. Currently, PI trades above both, suggesting a cautious bullish short-term outlook. However, the 200-day moving average (at $0.2847) remains above the spot price and is sloping downward, indicating an overall bearish trend.
Mass Deposits on CEX: Signal of Profit-Taking with 3.91 Million PI Tokens

(Source: PiScan)
Despite a cautiously bullish technical outlook, the continuous increase in CEX deposits signals notable downside risks:
-
Increased Circulating Supply Pressure: 3.91 million PI tokens transferred to centralized exchanges in 24 hours, up from 3.34 million the day before. Large CEX deposits often indicate holders preparing to sell.
-
Rising Local Top Risk: Persistent large deposits amid a 25% monthly gain suggest profit-taking could be intensifying.
-
Limited Rebound Momentum: After a 10% decline on Sunday, PI’s recovery lacks strength. Ongoing supply pressure on CEX further limits upside potential.
Key Technical Levels: Bulls and Bears on the Edge
(Source: TradingView)
Resistance Above: The immediate resistance is at $0.2396 (Saturday’s high). A successful break could target the 200-day exponential moving average (EMA) at $0.2847. However, the 200-day MA remains above the current price and is sloping downward, presenting structural resistance to upward movement.
Support Below: The key support level is at the 100-day moving average at $0.1977, near the psychological level of $0.2000. If this level is broken, the next support is at the 50-day moving average at $0.1828.
Frequently Asked Questions
Q: Where is the main resistance for Pi Network’s upward movement?
A: The immediate resistance is at $0.2396 (Saturday’s high). A break above this could target the 200-day EMA at $0.2847. However, the overall trend remains bearish as the 200-day MA is above and sloping downward, indicating structural resistance.
Q: What does the surge in CEX deposits mean for Pi Network’s price?
A: The 3.91 million PI tokens flowing into exchanges in the past 24 hours, up from 3.34 million the previous day, suggest holders are preparing to sell. This pattern, amid a 25% monthly gain, indicates profit-taking pressure and the potential formation of a local top.
Q: What do the current technical indicators suggest?
A: The indicators show mixed signals leaning cautiously bullish: RSI at 66 and rising; MACD above zero but with weakening momentum; the 50-day MA approaching the 100-day MA, possibly forming a golden cross. However, the 200-day MA remains above and downward sloping, indicating an overall bearish trend. A comprehensive assessment should consider multiple indicators.
Disclaimer: The information on this page may come from third parties and does not represent the views or opinions of Gate. The content displayed on this page is for reference only and does not constitute any financial, investment, or legal advice. Gate does not guarantee the accuracy or completeness of the information and shall not be liable for any losses arising from the use of this information. Virtual asset investments carry high risks and are subject to significant price volatility. You may lose all of your invested principal. Please fully understand the relevant risks and make prudent decisions based on your own financial situation and risk tolerance. For details, please refer to
Disclaimer.