Zcash (ZEC) pumped hard, but it hasn’t been able to hold up near the highs. Price is now stalling, and the chart is starting to look weak again.
Crypto analyst Cryptorphic shared a clear warning on ZEC, saying that the real move may still be down. His take is that Zcash is stuck under a major resistance level, buyers are losing energy, and the market is starting to look more like distribution than strength.
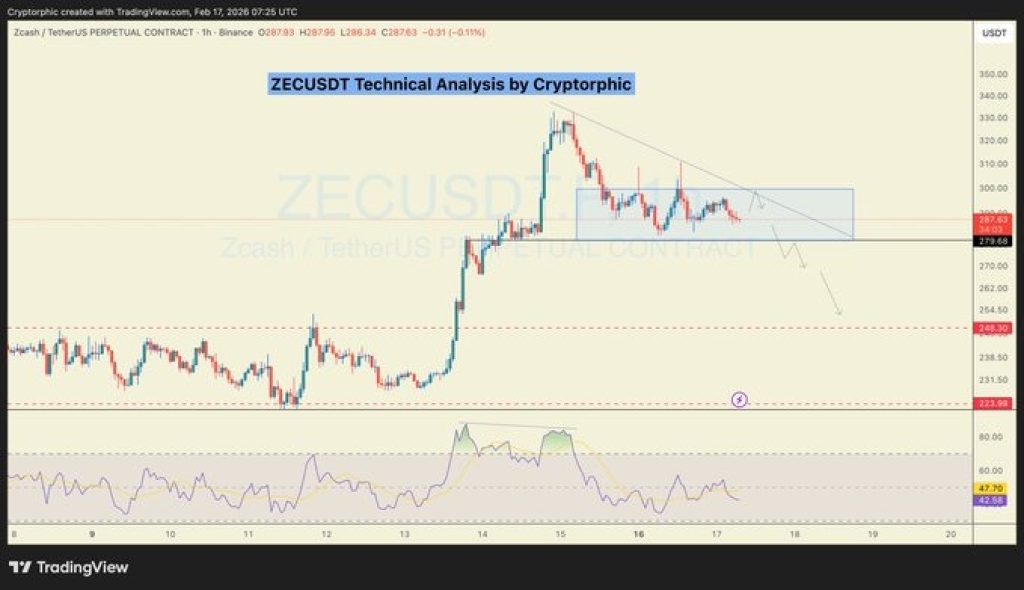
The first thing that stands out on the ZEC chart is the $300 zone. Zcash pushed into that area after the pump, but it failed to break through cleanly.
ZEC has been stuck below that level for days, and every bounce keeps losing strength. Sellers are clearly holding the line, and buyers aren’t pushing back hard enough.
As long as ZEC stays capped under $300, upside becomes limited and the risk of a deeper pullback grows.
Meanwhile, Cryptorphic highlights $281 as the most important support level right now, and the chart backs that up.
The Zcash price is sitting near the lower edge of the current range, and price action is tightening. This is the kind of zone where a breakdown can happen quickly if buyers step aside.
If ZEC loses $281, the structure breaks, and the chart opens up space toward the next major support.
Source: X/Cryptorphic
$255 Could Come Fast on a Breakdown For ZEC
The next downside target sits around $255. That level is marked clearly on the chart as the next support area below the range.
If $281 fails, there is not much in between to slow the move down. That’s why Cryptorphic says the door opens toward $255 fast.
This is where traders start paying close attention, because range breakdowns often trigger sharp follow-through selling.
_****XRP Manipulation Fears Rise as Analyst Flags Potential Liquidation Trap for Retail**
However, the RSI indicator on the chart is also rolling over. After the pump, momentum peaked, but it has been fading since then.
RSI is now drifting lower, which fits with the idea that buying strength is cooling off. When momentum fades near resistance, price often struggles to push higher. That adds more weight to the bearish outlook in the short term.
Zcash Price Outlook
Zcash delivered a strong pump, but the chart now looks heavy. Price is stuck below $300, support at $281 is under pressure, and momentum is fading.
Cryptorphic’s analysis points to a clear scenario: if the ZEC price breaks below $281, a drop toward $255 becomes the next logical move.
Until buyers reclaim $300 with strength, Zcash remains in a fragile spot, and this looks more like distribution than a fresh breakout phase.
Disclaimer: The information on this page may come from third parties and does not represent the views or opinions of Gate. The content displayed on this page is for reference only and does not constitute any financial, investment, or legal advice. Gate does not guarantee the accuracy or completeness of the information and shall not be liable for any losses arising from the use of this information. Virtual asset investments carry high risks and are subject to significant price volatility. You may lose all of your invested principal. Please fully understand the relevant risks and make prudent decisions based on your own financial situation and risk tolerance. For details, please refer to
Disclaimer.
Related Articles
HYPE Hits $35.53 After 2.4% Jump — Will Momentum Hold as Price Tests $35.59 Resistance?
Hyperliquid’s HYPE trades at $35.53, approaching the $35.59 resistance after a 2.4% daily gain.
The chart shows the $33.67 zone acting as support after price moved above a previously contested level.
Price now trades between $33.67 support and $35.59 resistance, shaping the immediate
CryptoNewsLand27m ago
Is Injective (INJ) a Dead Coin or the Next 2800% Opportunity? Here’s What The Chart Is Saying
The Injective price has fallen sharply from its previous all-time high, leading some traders to question whether the project has lost its momentum.
However, a recent technical analysis shared by top analyst Crypto Patel suggests that the recent decline may actually represent a typical
CaptainAltcoin1h ago
CFX 4-hour chart reaches a new high for the phase, with approximately 14% increase over 24 hours
Gate News: On March 15, market data shows that CFX reached a new phase high on the 4-hour K-line chart, with prices touching approximately 0.06282 USDT at their peak, representing a 24-hour gain of around 14%. Some community members believe this rally may be related to recent macroeconomic catalysts. Earlier, media outlets citing sources reported that Iran is considering allowing certain tankers to pass through the Strait of Hormuz on the condition that petroleum transport be settled in Chinese yuan. Related discussions have once again sparked market attention toward yuan stablecoins and cross-border payment narratives.
GateNews2h ago
After the network upgrade: What prospects await SOL?
The official approval of protocol SIMD-0266 aims to optimize computing efficiency on the Solana network by introducing p-tokens, simplifying transaction processing. This upgrade, set for April, has prompted increased buying activity and could lead to significant cost reductions and performance improvements.
TapChiBitcoin3h ago
Track FET's journey to the $0.24 milestone as the AI cryptocurrency sector records its most positive trading week in months
The cryptocurrency industry related to AI has recently recorded an impressive performance. According to data from CoinMarketCap, the total market capitalization of this sector has grown 16% in just the past week. Many leading tokens in this category have also achieved significant growth, attracting
TapChiBitcoin4h ago
DeFi enters a "winter of yields": liquidity stagnation, leverage contraction, and the disappearance of arbitrage opportunities
Since September 2025, the DeFi market has entered a "interest rate winter," with the annualized deposit yields of mainstream stablecoins dropping to lows, and supply and demand imbalances causing excess liquidity. As borrowing demand declines, stablecoin lending rates have also decreased, and the reduced risk appetite in the crypto market has led investors to shift toward more stable assets. Some protocols, such as Sky, offer stable returns through real-world assets, but the overall trend still indicates a period of adjustment and structural reform in DeFi.
区块客4h ago