
Hedera (HBAR) has been busy behind the scenes. FedEx has joined the Hedera Council, showing that large companies are getting involved.
Hedera was also featured in a World Economic Forum session on responsible AI, placing it in wider global talks. However, Hashgraph picked up a DEVIES Award for its work on HashSphere.
Despite all that, the HBAR price is trading around $0.098, and the chart still shows a cautious structure.
- Here’s What The Hedera Chart Is Showing
- What the Indicators Are Showing
- Hedera Price Targets to Watch This Week
Here’s What The Hedera Chart Is Showing
On the 4H chart, HBAR has been in a steady downtrend for months. Price kept printing lower highs and slowly sliding from the $0.18–$0.20 area down toward the recent low near $0.072.
After touching that low, the HBAR price bounced and is now hovering just under the $0.10 mark. The chart looks more like a pause after a long drop than a real breakout.
Price is moving sideways between $0.095 and $0.10. That range is where buyers and sellers are fighting right now.
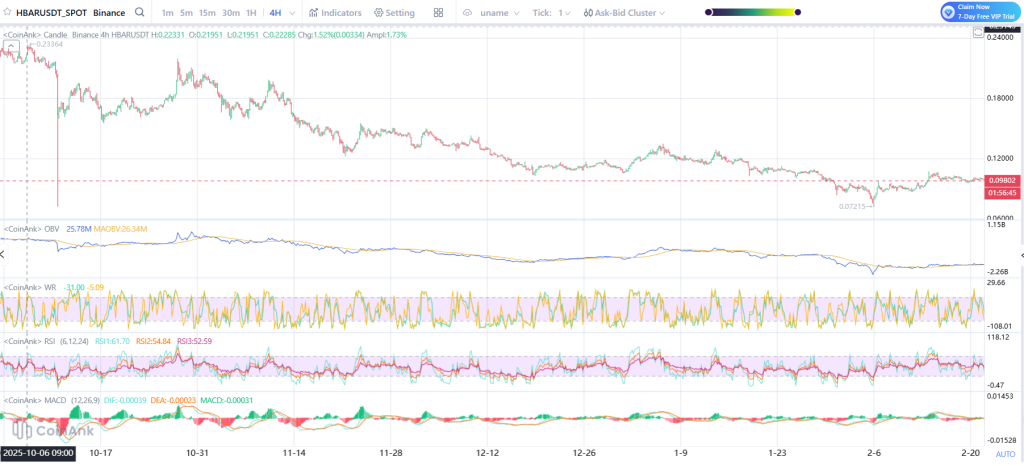
Source: Coinank
What the Indicators Are Showing
OBV has flattened after trending down for weeks. This implies that the selling pressure has eased, but the strong buying force has not yet fully come back.
The Williams %R indicator is currently close to the middle area, indicating that HBAR is not significantly oversold or overbought. The RSI is also close to the middle area, confirming the previous statement.
The MACD indicator is close to the zero level with small histogram bars. This typically indicates that the momentum is weak and the market is awaiting a signal. However, the HBAR price is stable, but there is no strong force yet.
_****Here’s Where Ripple’s XRP Price Could Be Headed This New Week**
Hedera Price Targets to Watch This Week
If HBAR stays above $0.095 and moves up, $0.11 is the first level to watch. After that, $0.12 is the next area where price struggled before.
If the buying interest is able to overcome the $0.12 level, a move towards $0.14 may be expected.
However, failure to hold above $0.095 could see the HBAR price could return towards $0.085, with the stronger level at $0.072 yet to be tested.
For now, HBAR is trading in a tight range. A decisive break above $0.11 or below $0.095 is likely to determine just how high, or how low, Hedera will go this week.
Disclaimer: The information on this page may come from third parties and does not represent the views or opinions of Gate. The content displayed on this page is for reference only and does not constitute any financial, investment, or legal advice. Gate does not guarantee the accuracy or completeness of the information and shall not be liable for any losses arising from the use of this information. Virtual asset investments carry high risks and are subject to significant price volatility. You may lose all of your invested principal. Please fully understand the relevant risks and make prudent decisions based on your own financial situation and risk tolerance. For details, please refer to
Disclaimer.
Related Articles
Billionaire Investor Stanley Druckenmiller Bullish on Stablecoin Growth
Billionaire investor Stanley Druckenmiller believes stablecoins will become the backbone of the financial system in 10-15 years, citing their efficiency. However, he views much of the wider crypto market as unnecessary, describing it as “a solution looking for a problem.”
Decrypt19m ago
Bitcoin Cash Battles $459 Resistance as Massive Sell Walls Stack Toward $650
BCH is trading at $455.86 close to the resistance range of $459.20 with the support level of $447.44.
The chart data indicates that the chart has strong resistance levels at around $520, $580 and $650 which restricts the momentum on short term upside.
Following a sharp fall, price
CryptoNewsLand59m ago
PEPE Consolidates Above $0.05324 Support as Momentum Strengthens and Resistance Near $0.05336 Holds
PEPE has a tight intraday price compression with a support level of $0.053243 and resistance level of $0.053363.
A RSI of 64.13 represents the moderate bullish momentum whereas MACD history is slightly positive, which indicates the gradual buying momentum.
The price is at $0.053364
CryptoNewsLand1h ago
HYPE Hits $35.53 After 2.4% Jump — Will Momentum Hold as Price Tests $35.59 Resistance?
Hyperliquid’s HYPE trades at $35.53, approaching the $35.59 resistance after a 2.4% daily gain.
The chart shows the $33.67 zone acting as support after price moved above a previously contested level.
Price now trades between $33.67 support and $35.59 resistance, shaping the immediate
CryptoNewsLand1h ago
Cardano áp sát mốc 0,28 USD khi lực mua nhỏ lẻ tăng mạnh – Đà bứt phá đã cận kề?
The current price of Cardano (ADA) is around $0.270, having risen from a support level of $0.254-$0.260. It underwent a dip to $0.2194 before buyers returned, leading to a structure indicating accumulation. The price tests resistance at $0.287, while whale activity raises market uncertainty. Despite a reduction in ADA holdings among large wallets, the supply remains concentrated in their hands, suggesting strategic liquidity reallocation rather than widespread selling. Meanwhile, retail investors continue accumulating ADA.
TapChiBitcoin4h ago
Bitcoin MVRV Z-Score Drops Below 1 Again
The MVRV Z-Score is a key on-chain indicator for assessing Bitcoin's value by comparing market and realized capitalizations. Historical data shows that when the score drops below 1, it often signals significant market recovery. However, changing market dynamics and institutional influences may alter future patterns.
Coinfomania4h ago