Trade
Basic
Futures
Futures
Hundreds of contracts settled in USDT or BTC
TradFi
Gold
Trade global traditional assets with USDT in one place
Options
Hot
Trade European-style vanilla options
Unified Account
Maximize your capital efficiency
Demo Trading
Futures Kickoff
Get prepared for your futures trading
Futures Events
Participate in events to win generous rewards
Demo Trading
Use virtual funds to experience risk-free trading
Earn
Launch
CandyDrop
Collect candies to earn airdrops
Launchpool
Quick staking, earn potential new tokens
HODLer Airdrop
Hold GT and get massive airdrops for free
Launchpad
Be early to the next big token project
Alpha Points
Trade on-chain assets and enjoy airdrop rewards!
Futures Points
Earn futures points and claim airdrop rewards
Investment
Simple Earn
Earn interests with idle tokens
Auto-Invest
Auto-invest on a regular basis
Dual Investment
Buy low and sell high to take profits from price fluctuations
Soft Staking
Earn rewards with flexible staking
Crypto Loan
0 Fees
Pledge one crypto to borrow another
Lending Center
One-stop lending hub
VIP Wealth Hub
Customized wealth management empowers your assets growth
Private Wealth Management
Customized asset management to grow your digital assets
Quant Fund
Top asset management team helps you profit without hassle
Staking
Stake cryptos to earn in PoS products
Smart Leverage
New
No forced liquidation before maturity, worry-free leveraged gains
GUSD Minting
Use USDT/USDC to mint GUSD for treasury-level yields
More
# 以太坊
6.65M
GateUser-cdf65c10
Market Status: Are the Bulls Dominant?
Currently, the market is in the "short-term oversold rebound followed by bulls attempting to regain dominance" phase.
1. Support Confirmation: The 4-hour and 1-hour charts show that ETH has formed a clear double bottom or support stabilization in the 2886-2900 range.
2. Indicator Resonance:
• 1-hour/4-hour charts: Price has successfully broken through the middle band (BOLL) of the Bollinger Bands, MACD has completed a golden cross below the 0 line and started to expand, a typical rebound initiation signal.
• Daily chart: Price has retested the daily middl
ETH-9.81%
- Reward
- 2
- 2
- Repost
- Share
GateUser-4077d3f8 :
:
Both double bottoms have been broken through.View More
Market Status: Are the Bulls Dominant?
Currently, the market is in the "short-term oversold rebound followed by bulls attempting to regain dominance" phase.
1. Support Confirmation: The 4-hour and 1-hour charts show that ETH has formed a clear double bottom or support stabilization in the 2886-2900 range.
2. Indicator Resonance:
• 1-hour/4-hour charts: Price has successfully broken through the middle band (BOLL) of the Bollinger Bands, MACD has completed a golden cross below the 0 line and started to expand, a typical rebound initiation signal.
• Daily chart: Price has retested the daily middl
Currently, the market is in the "short-term oversold rebound followed by bulls attempting to regain dominance" phase.
1. Support Confirmation: The 4-hour and 1-hour charts show that ETH has formed a clear double bottom or support stabilization in the 2886-2900 range.
2. Indicator Resonance:
• 1-hour/4-hour charts: Price has successfully broken through the middle band (BOLL) of the Bollinger Bands, MACD has completed a golden cross below the 0 line and started to expand, a typical rebound initiation signal.
• Daily chart: Price has retested the daily middl
ETH-9.81%

- Reward
- 5
- 1
- Repost
- Share
CryptoSpecto:
good informationEthereum 1-Hour Technical Analysis:
1. Price Trend
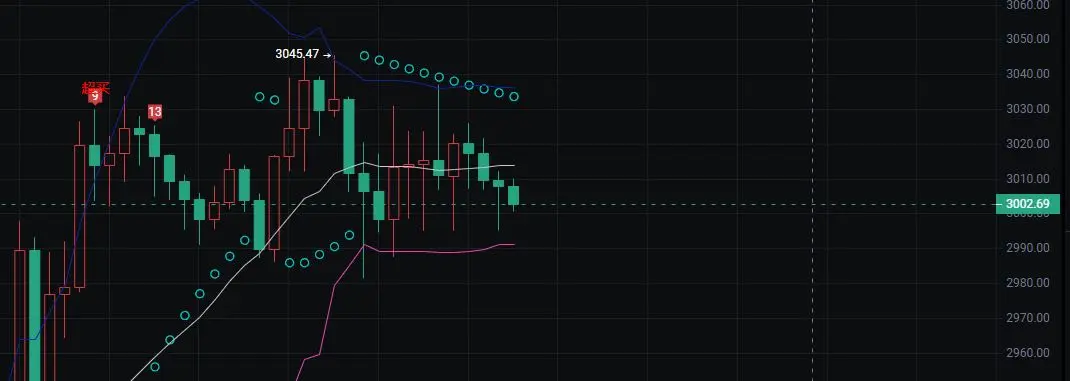
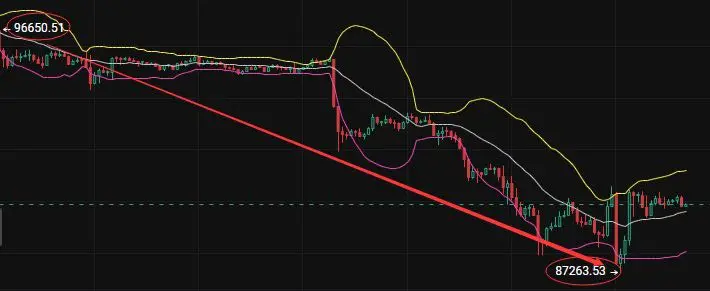
The price previously surged to 3045.47 and faced resistance, then pulled back. It has now broken below short-term support levels, indicating a correction phase.
The latest price at 3002.69 has fallen back into the previous consolidation zone's lower boundary, showing some short-term support. However, if it breaks below, further decline may occur.
2. Indicator Signals
Blue Moving Average (similar to Bollinger Band upper band / MA20): The price has fallen from above this MA to below it, indicating weakening short-term bullish momentum and a mark
View Original1. Price Trend
The price previously surged to 3045.47 and faced resistance, then pulled back. It has now broken below short-term support levels, indicating a correction phase.
The latest price at 3002.69 has fallen back into the previous consolidation zone's lower boundary, showing some short-term support. However, if it breaks below, further decline may occur.
2. Indicator Signals
Blue Moving Average (similar to Bollinger Band upper band / MA20): The price has fallen from above this MA to below it, indicating weakening short-term bullish momentum and a mark
- Reward
- 3
- Comment
- Repost
- Share
- Reward
- 2
- 4
- Repost
- Share
CryptocurrencyInsights :
:
Accurate deliveryView More
Breaking below 3000 sparks a shockwave! When will Ethereum's short-term turning point appear?
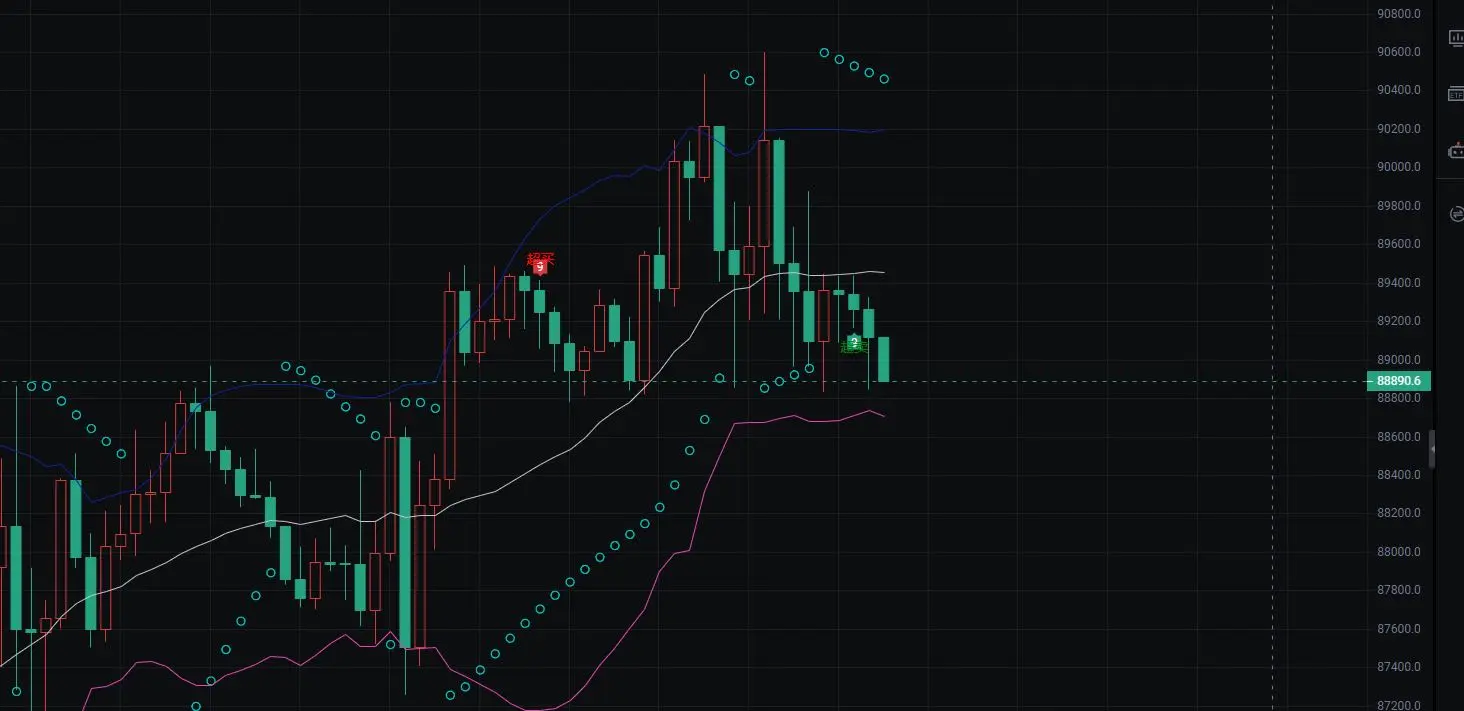
Multiple bearish factors are resonating to suppress Ethereum's trend. Tonight, Cheng Jingsheng will provide a simple analysis from two aspects. First, in terms of news, the escalation of US-EU trade friction has triggered a risk-off sentiment in global risk assets, leading to continuous outflows from the crypto market; the US January CPI data is about to be released, reinforcing expectations of prolonged high interest rates by the Federal Reserve, and the cost of holding cryptocurrencies remains high.
View OriginalMultiple bearish factors are resonating to suppress Ethereum's trend. Tonight, Cheng Jingsheng will provide a simple analysis from two aspects. First, in terms of news, the escalation of US-EU trade friction has triggered a risk-off sentiment in global risk assets, leading to continuous outflows from the crypto market; the US January CPI data is about to be released, reinforcing expectations of prolonged high interest rates by the Federal Reserve, and the cost of holding cryptocurrencies remains high.


MC:$4.11KHolders:4
3.22%
- Reward
- 1
- Comment
- Repost
- Share
RT☁777 Daily Analysis
1.26 ETH completely underperformed! The 2950 level was directly broken, over 8 billion in orders set off mines, the deflation myth shattered into pieces, and L2 is still aggressively draining liquidity from the mainnet.
#以太坊 #ETH #加密行情 #Mainstream coins weak
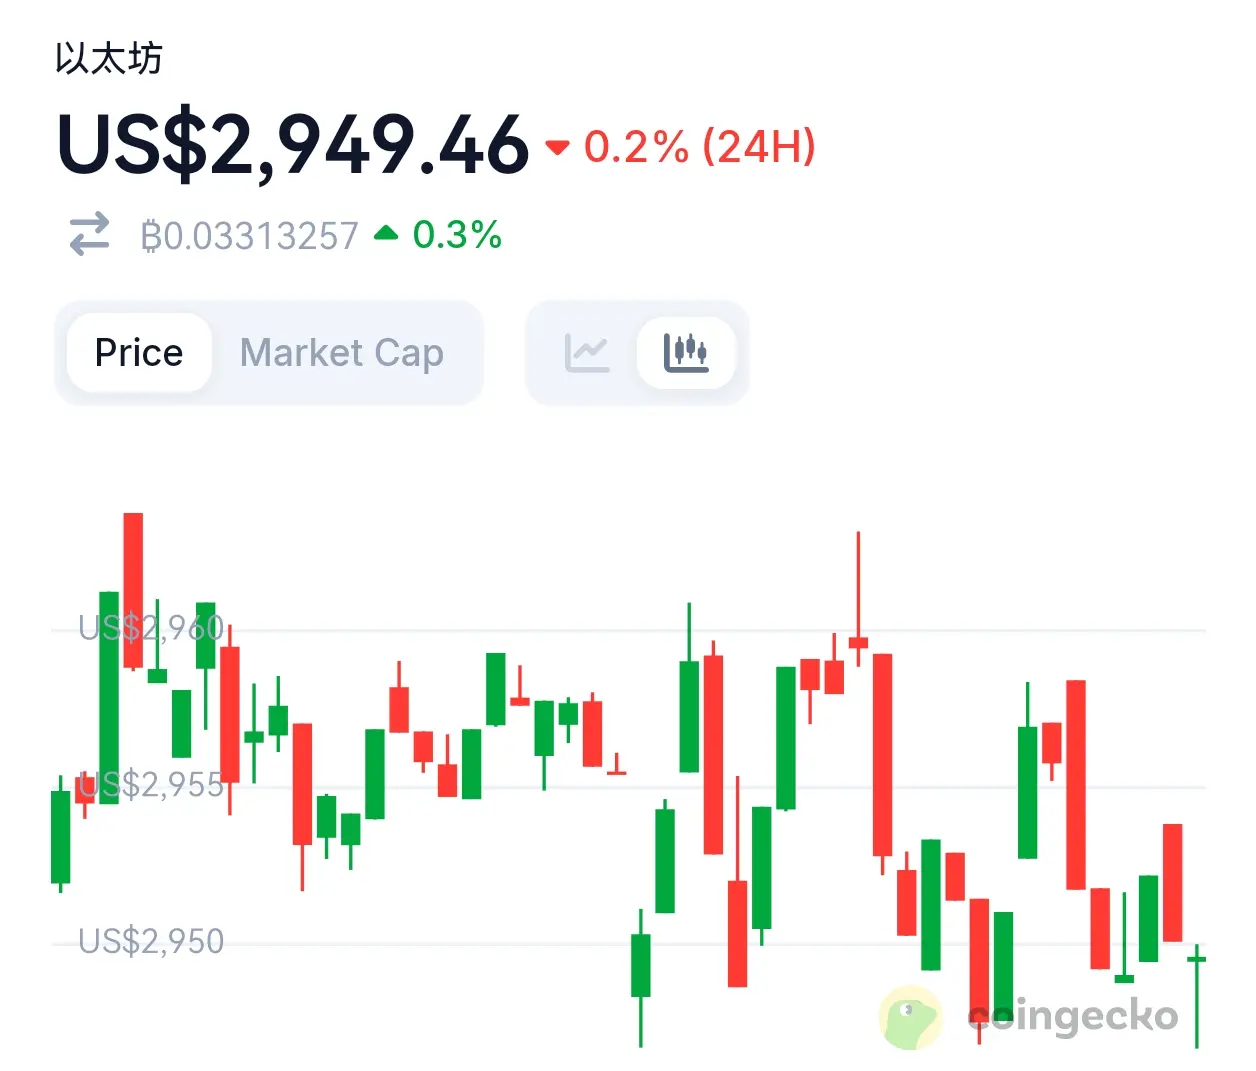
On 2026.1.26, ETH’s weakness was etched into its bones. The current price is $2949, down 0.6% in 24h, breaking the critical 2950 level without resistance. The overall crypto market remains stable, BTC consolidates, SOL oscillates higher, but ETH can’t even hold a whole number level. The problem of not following the ma
View Original1.26 ETH completely underperformed! The 2950 level was directly broken, over 8 billion in orders set off mines, the deflation myth shattered into pieces, and L2 is still aggressively draining liquidity from the mainnet.
#以太坊 #ETH #加密行情 #Mainstream coins weak
On 2026.1.26, ETH’s weakness was etched into its bones. The current price is $2949, down 0.6% in 24h, breaking the critical 2950 level without resistance. The overall crypto market remains stable, BTC consolidates, SOL oscillates higher, but ETH can’t even hold a whole number level. The problem of not following the ma

- Reward
- 1
- 1
- Repost
- Share
BigDioTrader:
Take off🛫🛫🛫🛫🛫🛫🛫🛫🛫🛫🛫🛫🛫🛫🛫🛫🛫🛫🛫🛫🛫🛫🛫🛫🛫🛫🛫🛫🛫🛫🛫🛫🛫🛫🛫🛫🛫🛫🛫🛫🛫🛫🛫🛫🛫🛫🛫🛫🛫🛫🛫🛫🛫🛫🛫🛫🛫🛫🛫🛫🛫🛫🛫🛫🛫🛫🛫🛫🛫🛫ETH Market Analysis January 24, 2025, 10:00
As of 10 PM, the candlestick chart shows a pin bar oscillation with little fluctuation.
The price is around 2950, with the Bollinger Bands narrowing, and the three lines near 2970, 3030, and 2900.
In the short term, the MA5 and MA10 moving averages have crossed, forming two silver ingot shapes, then moving parallel.
MACD indicator: The MACD double lines are below the zero line, crossing and moving upward after parallelism, indicating bullish momentum is building.
RSI indicator: RSI14 is around 37, approaching the oversold stage.
Resistance levels: 30
ETH-9.81%
- Reward
- 1
- Comment
- Repost
- Share
Recruitment Notice | Gather the Trend Followers
The market never lacks opportunities; what’s missing are awareness, patience, and execution.
If you’re tired of chasing highs and selling lows, fed up with emotional trading;
If you recognize trends, respect structure, and only engage in high-probability swing trades—
Here, we provide logic, not calls;
Here, we emphasize discipline, not emotions;
Keep up with the rhythm, and profits will naturally follow you.
Threshold: 5000U
Not exclusionary, but selective.
Filter out speculative mindsets, and keep those who truly want to ride the waves.
The pre
View OriginalThe market never lacks opportunities; what’s missing are awareness, patience, and execution.
If you’re tired of chasing highs and selling lows, fed up with emotional trading;
If you recognize trends, respect structure, and only engage in high-probability swing trades—
Here, we provide logic, not calls;
Here, we emphasize discipline, not emotions;
Keep up with the rhythm, and profits will naturally follow you.
Threshold: 5000U
Not exclusionary, but selective.
Filter out speculative mindsets, and keep those who truly want to ride the waves.
The pre
- Reward
- 1
- 1
- Repost
- Share
趋势阿特:
New Year Wealth Explosion 🤑If you're not familiar, it's recommended to stay cautious and avoid operating in market conditions you don't understand. Last night, I actually missed quite a few opportunities, but because I wasn't confident enough to act, I hesitated. The market's intentions are unclear. #Ethereum
ETH-9.81%
- Reward
- like
- Comment
- Repost
- Share
🚨 ETH Tonight's Life-and-Death Battle | I've Already Set the Direction for You
It's not that there hasn't been a market in the past few days
It's that I'm waiting for the most critical moment
Now, let's focus on the key points 👇
🎯 Current Market Situation
Main force at 2900 – 3100
Madly sweeping retail investors' chips back and forth
✔ Chase high → Sell immediately
✔ Panic sell → Pull up instantly
This is not a market
This is a hunting scene
⚔ Critical position
🟢 Strong support: 2880 – 2920
🔴 Strong resistance: 3120 – 3200
Tonight, only watch for two situations:
① Stand firm at 3100
→ Dir
ETH-9.81%
- Reward
- like
- 3
- Repost
- Share
ThirteenAunts:
It's really heartbreaking to see around 2850View More
Load More
Join 40M users in our growing community
⚡️ Join 40M users in the crypto craze discussion
💬 Engage with your favorite top creators
👍 See what interests you
Trending Topics
374.16K Popularity
1.89K Popularity
2.2K Popularity
1.08K Popularity
624 Popularity
939 Popularity
312 Popularity
544 Popularity
1.75K Popularity
23 Popularity
32.8K Popularity
67.06K Popularity
19.66K Popularity
25K Popularity
218.51K Popularity
News
View MoreSKR (Solana Mobile Seeker) increased by 15.86% in the past 24 hours
8 m
India's 2026 Budget Takes a Hardline Approach to Crypto Regulation: No Change in Tax Rates + New Penalties for Violations, Investors' Costs May Rise Again
8 m
India's 2026 Budget maintains cryptocurrency taxation and withholding tax unchanged, with new penalties introduced for violations.
11 m
Spot gold drops below $4,500 as prices weaken amid global economic uncertainties and fluctuating dollar strength. Investors are closely watching the market for further signs of stability or continued decline.
13 m
Liquidation King "Air Force Commander" clears all 500 million holdings, only $60,000 remaining to exit the market
16 m
Pin