
#BTCMarketAnalysis
Bitcoin is currently trading at approximately 62,350 dollars, representing a significant pullback from the recent high of around 67,000 dollars. This decline of roughly 4,650 dollars, or about 7 percent, has left many investors questioning the sustainability of the recent rally and searching for answers about what triggered this sudden reversal.
The Price Action Journey: From 67,000 Dollars to 62,350 Dollars
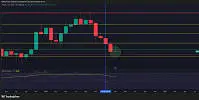
Bitcoin's journey from the 67,000 dollars level to the current 62,350 dollars represents a classic case of a market caught between conflicting macro forces. The digital asset had shown remarkable resilience, climbing past 66,000 dollars and even touching 67,000 dollars amid hopes of a geopolitical resolution. However, the failure to sustain these gains has resulted in a retracement that has tested critical support zones.
Over the past 24 hours, Bitcoin has traded in a range between 61,932 dollars and 65,619.5 dollars, with volume expansion during the decline indicating genuine selling pressure rather than mere consolidation. The daily timeframe reveals a concerning technical picture with MA7 below MA30 and MA30 below MA120, forming a death cross pattern that typically signals bearish momentum. The RSI has dropped to around 36.3, placing Bitcoin in oversold territory and suggesting that a short-term bounce could be imminent.
Why Did Bitcoin Fall Despite Positive Iran Talks Developments
The apparent contradiction between the Iran ceasefire talks concluding and Bitcoin's decline requires careful examination. While the United States and Iran announced a preliminary peace deal on Sunday, June 16, 2026, the market reaction was far from uniformly positive.
First, the ceasefire agreement, while significant, came with substantial caveats. Iran's Khatam al-Anbiya Central Headquarters declared it would close the Strait of Hormuz to vessel traffic, attributing the decision to alleged failures by the United States to implement crucial parts of the ceasefire agreement. This threat to one of the world's most critical shipping lanes introduced fresh uncertainty into global markets.
Second, the crypto market had already priced in much of the geopolitical optimism. When Bitcoin climbed past 67,000 dollars, it was anticipating a clean resolution. The reality proved messier, with Iran conditioning any resumption of talks on a full halt to Israeli military operations in Lebanon and Gaza. Vice President J.D. Vance's planned travel to Switzerland for negotiations, while diplomatically significant, also highlighted that the conflict remains far from resolved.
Third, the crypto market demonstrated its characteristic tendency to sell the news. Bitcoin's price action showed that traders who had bought the rumor were quick to exit positions once the actual developments materialized, creating downward pressure even as traditional risk assets like equities rallied.
The CPI and PPI Data Impact
The inflation data released in June 2026 has been a critical factor in Bitcoin's price decline. The Consumer Price Index landed at 4.2 percent year-over-year, representing the highest inflation reading since April 2023. This figure significantly exceeded market expectations and the Federal Reserve's 2 percent target.
Breaking down the inflation components reveals the severity of the situation. Energy prices surged 23.5 percent, with gasoline prices jumping 40.5 percent. These figures directly reflect the energy shock caused by the Iran conflict and its impact on global oil markets. The Producer Price Index similarly showed elevated readings, confirming that inflationary pressures are permeating through the entire supply chain.
For Bitcoin, this inflation data was doubly damaging. Initially, Bitcoin had benefited from the narrative that it serves as an inflation hedge. However, when inflation becomes too high and persistent, it triggers concerns about aggressive monetary policy responses that could tighten financial conditions and reduce risk appetite across all asset classes, including cryptocurrencies.
The Federal Reserve Meeting and Kevin Warsh's Debut
The June 16 to 17 Federal Open Market Committee meeting marked Kevin Warsh's first as Federal Reserve Chairman, and his inaugural press conference delivered several surprises that rattled markets.
Warsh announced the establishment of five task forces addressing the Fed's communications, balance sheet, data sources, productivity and jobs, and inflation frameworks. More significantly, he declined to participate in the dot plot, the central bank's projections of where rates will be in the future, signaling a departure from forward guidance that markets had grown accustomed to.
The Federal Reserve held interest rates steady at 3.50 percent to 3.75 percent, but the policy statement underwent substantial changes. Language suggesting future rate cuts was removed, replaced with more neutral wording that allows for the possibility of rate hikes. Roughly half of the rate-setting committee projected at least one rate hike in 2026, a dramatic shift from earlier expectations of rate cuts.
This hawkish pivot has profound implications for Bitcoin. Higher interest rates increase the opportunity cost of holding non-yielding assets like Bitcoin. Additionally, tighter monetary conditions typically reduce liquidity in financial markets, making it more difficult for speculative assets to maintain elevated valuations.
Technical Analysis: Support and Resistance Levels
Understanding the technical landscape is crucial for navigating the current market environment. Bitcoin is currently trading in what analysts describe as no man's land, below the 50-day and 200-day simple moving averages but holding short-term structure.
Key support levels demand immediate attention. The immediate support zone sits between 63,500 dollars and 63,000 dollars, representing local support confluence including the 4-hour 100 moving average and nPOC. The next major support lies at 62,260 dollars to 62,000 dollars, coinciding with the 200-week moving average, which has historically acted as a major long-term floor for Bitcoin.
Deeper support levels include 61,000 dollars, 59,110 dollars to 58,900 dollars representing the cycle low area, and 60,700 dollars if lower levels break. Losing the 64,000 dollars to 63,500 dollars zone could open the path toward 60,000 dollars to 58,000 dollars, representing a significant downside extension.
On the resistance side, immediate resistance is found between 64,350 dollars and 64,763 dollars, marking recent pivot and rejection zones. The near-term resistance cluster spans 65,300 dollars to 66,300 dollars, encompassing local medium-term resistance and value areas. Higher targets include 67,000 dollars to 67,008 dollars, representing point of control and simple moving average confluence, and 70,000 dollars, which would need to be reclaimed for bullish continuation.
A sustained break above 65,000 dollars to 67,000 dollars would likely target 68,000 dollars to 70,000 dollars next, potentially signaling a return to bullish momentum.
On-Chain and Market Structure Analysis
Bitcoin's market structure reveals important insights about underlying demand and supply dynamics. The Fear and Greed Index remains at a deep 23, indicating extreme fear among market participants. Historically, such readings have often coincided with local bottoms, though they do not guarantee immediate reversals.
Bitcoin dominance stands at 56.5 percent, with altcoins continuing to lag behind. This divergence between equity optimism and crypto extreme fear represents a defining tension in current market conditions. While traditional markets have rallied on geopolitical relief, cryptocurrency markets have remained cautious, reflecting concerns about liquidity conditions and regulatory uncertainty.
Institutional flows have been a significant headwind. Persistent institutional selling over the past four weeks, reflected in elevated outflows from spot Bitcoin exchange-traded funds, has weakened demand. Strategy, formerly MicroStrategy, continues to accumulate Bitcoin, having purchased another 1,587 Bitcoin and lifting its cash reserve to 1.1 billion dollars. However, this institutional buying has not been sufficient to offset broader selling pressure.
Bitcoin's Sharpe ratio has hit a level that has marked every cycle low since 2015. While this suggests the bear phase may be approaching exhaustion, historical precedent indicates that such signals typically precede months of basing rather than immediate rebounds.
The Week Ahead: Will Bitcoin Go Lower or Recover
The next week presents several critical catalysts that will determine Bitcoin's trajectory. The Federal Reserve's policy stance remains the dominant macro factor. With markets now pricing in a possible rate hike within months, any additional hawkish commentary from Fed officials could pressure Bitcoin lower.
Geopolitical developments surrounding the Iran negotiations will continue to influence risk sentiment. The formal Iran signing scheduled for Friday in Switzerland represents a potential volatility event. If talks progress smoothly and the Strait of Hormuz remains open, risk assets including Bitcoin could benefit. Conversely, any escalation or breakdown in negotiations would likely trigger fresh selling.
Technical factors suggest Bitcoin is approaching oversold conditions on multiple timeframes. Both 15-minute and 4-hour cycles show Williams Percent Range and Commodity Channel Index in oversold zones, indicating potential for short-term rebounds. The narrowing Bollinger Band width suggests an imminent breakout in either direction.
Trading Plan and Strategy
For traders navigating this environment, risk management takes precedence. The current market structure suggests maintaining tight stops of 1 to 2 percent and waiting for clear breakouts before establishing significant positions.
A bullish scenario would require Bitcoin to reclaim 65,000 dollars with conviction, ideally accompanied by expanding volume. Such a move would target 67,000 dollars initially, with 70,000 dollars representing the key level for trend reversal confirmation.
A bearish extension would be confirmed by a breakdown below 62,000 dollars, potentially opening the door to 60,000 dollars and possibly 58,000 dollars. Traders should watch the 62,260 dollars level closely, as the 200-week moving average has historically provided substantial support.
Range-bound strategies may be appropriate given the current uncertainty. Trading the range between 62,000 dollars and 65,000 dollars with clear stop losses outside these boundaries could capture short-term moves while limiting downside exposure.
Conclusion
Bitcoin's decline from 67,000 dollars to 62,350 dollars reflects a complex interplay of geopolitical uncertainty, inflation concerns, and shifting monetary policy expectations. While the Iran talks concluded with a preliminary agreement, the messy reality of implementation and ongoing tensions around the Strait of Hormuz have limited the positive impact on crypto markets.
The Federal Reserve's hawkish pivot under Chairman Kevin Warsh has introduced fresh uncertainty about the path of interest rates, with markets now contemplating rate hikes rather than cuts. This shift in monetary policy expectations has weighed on risk assets broadly.
The week ahead will be pivotal. Traders should monitor the 62,000 dollars to 62,260 dollars support zone closely, as a breakdown could accelerate selling toward 60,000 dollars. Conversely, a reclaim of 65,000 dollars would signal improving conditions and potentially set the stage for a test of 67,000 dollars to 70,000 dollars.
@Gate_Square #FirstRoundOfUSIranTalksConcludes #MyGateTradeStory
Bitcoin is currently trading at approximately 62,350 dollars, representing a significant pullback from the recent high of around 67,000 dollars. This decline of roughly 4,650 dollars, or about 7 percent, has left many investors questioning the sustainability of the recent rally and searching for answers about what triggered this sudden reversal.
The Price Action Journey: From 67,000 Dollars to 62,350 Dollars
Bitcoin's journey from the 67,000 dollars level to the current 62,350 dollars represents a classic case of a market caught between conflicting macro forces. The digital asset had shown remarkable resilience, climbing past 66,000 dollars and even touching 67,000 dollars amid hopes of a geopolitical resolution. However, the failure to sustain these gains has resulted in a retracement that has tested critical support zones.
Over the past 24 hours, Bitcoin has traded in a range between 61,932 dollars and 65,619.5 dollars, with volume expansion during the decline indicating genuine selling pressure rather than mere consolidation. The daily timeframe reveals a concerning technical picture with MA7 below MA30 and MA30 below MA120, forming a death cross pattern that typically signals bearish momentum. The RSI has dropped to around 36.3, placing Bitcoin in oversold territory and suggesting that a short-term bounce could be imminent.
Why Did Bitcoin Fall Despite Positive Iran Talks Developments
The apparent contradiction between the Iran ceasefire talks concluding and Bitcoin's decline requires careful examination. While the United States and Iran announced a preliminary peace deal on Sunday, June 16, 2026, the market reaction was far from uniformly positive.
First, the ceasefire agreement, while significant, came with substantial caveats. Iran's Khatam al-Anbiya Central Headquarters declared it would close the Strait of Hormuz to vessel traffic, attributing the decision to alleged failures by the United States to implement crucial parts of the ceasefire agreement. This threat to one of the world's most critical shipping lanes introduced fresh uncertainty into global markets.
Second, the crypto market had already priced in much of the geopolitical optimism. When Bitcoin climbed past 67,000 dollars, it was anticipating a clean resolution. The reality proved messier, with Iran conditioning any resumption of talks on a full halt to Israeli military operations in Lebanon and Gaza. Vice President J.D. Vance's planned travel to Switzerland for negotiations, while diplomatically significant, also highlighted that the conflict remains far from resolved.
Third, the crypto market demonstrated its characteristic tendency to sell the news. Bitcoin's price action showed that traders who had bought the rumor were quick to exit positions once the actual developments materialized, creating downward pressure even as traditional risk assets like equities rallied.
The CPI and PPI Data Impact
The inflation data released in June 2026 has been a critical factor in Bitcoin's price decline. The Consumer Price Index landed at 4.2 percent year-over-year, representing the highest inflation reading since April 2023. This figure significantly exceeded market expectations and the Federal Reserve's 2 percent target.
Breaking down the inflation components reveals the severity of the situation. Energy prices surged 23.5 percent, with gasoline prices jumping 40.5 percent. These figures directly reflect the energy shock caused by the Iran conflict and its impact on global oil markets. The Producer Price Index similarly showed elevated readings, confirming that inflationary pressures are permeating through the entire supply chain.
For Bitcoin, this inflation data was doubly damaging. Initially, Bitcoin had benefited from the narrative that it serves as an inflation hedge. However, when inflation becomes too high and persistent, it triggers concerns about aggressive monetary policy responses that could tighten financial conditions and reduce risk appetite across all asset classes, including cryptocurrencies.
The Federal Reserve Meeting and Kevin Warsh's Debut
The June 16 to 17 Federal Open Market Committee meeting marked Kevin Warsh's first as Federal Reserve Chairman, and his inaugural press conference delivered several surprises that rattled markets.
Warsh announced the establishment of five task forces addressing the Fed's communications, balance sheet, data sources, productivity and jobs, and inflation frameworks. More significantly, he declined to participate in the dot plot, the central bank's projections of where rates will be in the future, signaling a departure from forward guidance that markets had grown accustomed to.
The Federal Reserve held interest rates steady at 3.50 percent to 3.75 percent, but the policy statement underwent substantial changes. Language suggesting future rate cuts was removed, replaced with more neutral wording that allows for the possibility of rate hikes. Roughly half of the rate-setting committee projected at least one rate hike in 2026, a dramatic shift from earlier expectations of rate cuts.
This hawkish pivot has profound implications for Bitcoin. Higher interest rates increase the opportunity cost of holding non-yielding assets like Bitcoin. Additionally, tighter monetary conditions typically reduce liquidity in financial markets, making it more difficult for speculative assets to maintain elevated valuations.
Technical Analysis: Support and Resistance Levels
Understanding the technical landscape is crucial for navigating the current market environment. Bitcoin is currently trading in what analysts describe as no man's land, below the 50-day and 200-day simple moving averages but holding short-term structure.
Key support levels demand immediate attention. The immediate support zone sits between 63,500 dollars and 63,000 dollars, representing local support confluence including the 4-hour 100 moving average and nPOC. The next major support lies at 62,260 dollars to 62,000 dollars, coinciding with the 200-week moving average, which has historically acted as a major long-term floor for Bitcoin.
Deeper support levels include 61,000 dollars, 59,110 dollars to 58,900 dollars representing the cycle low area, and 60,700 dollars if lower levels break. Losing the 64,000 dollars to 63,500 dollars zone could open the path toward 60,000 dollars to 58,000 dollars, representing a significant downside extension.
On the resistance side, immediate resistance is found between 64,350 dollars and 64,763 dollars, marking recent pivot and rejection zones. The near-term resistance cluster spans 65,300 dollars to 66,300 dollars, encompassing local medium-term resistance and value areas. Higher targets include 67,000 dollars to 67,008 dollars, representing point of control and simple moving average confluence, and 70,000 dollars, which would need to be reclaimed for bullish continuation.
A sustained break above 65,000 dollars to 67,000 dollars would likely target 68,000 dollars to 70,000 dollars next, potentially signaling a return to bullish momentum.
On-Chain and Market Structure Analysis
Bitcoin's market structure reveals important insights about underlying demand and supply dynamics. The Fear and Greed Index remains at a deep 23, indicating extreme fear among market participants. Historically, such readings have often coincided with local bottoms, though they do not guarantee immediate reversals.
Bitcoin dominance stands at 56.5 percent, with altcoins continuing to lag behind. This divergence between equity optimism and crypto extreme fear represents a defining tension in current market conditions. While traditional markets have rallied on geopolitical relief, cryptocurrency markets have remained cautious, reflecting concerns about liquidity conditions and regulatory uncertainty.
Institutional flows have been a significant headwind. Persistent institutional selling over the past four weeks, reflected in elevated outflows from spot Bitcoin exchange-traded funds, has weakened demand. Strategy, formerly MicroStrategy, continues to accumulate Bitcoin, having purchased another 1,587 Bitcoin and lifting its cash reserve to 1.1 billion dollars. However, this institutional buying has not been sufficient to offset broader selling pressure.
Bitcoin's Sharpe ratio has hit a level that has marked every cycle low since 2015. While this suggests the bear phase may be approaching exhaustion, historical precedent indicates that such signals typically precede months of basing rather than immediate rebounds.
The Week Ahead: Will Bitcoin Go Lower or Recover
The next week presents several critical catalysts that will determine Bitcoin's trajectory. The Federal Reserve's policy stance remains the dominant macro factor. With markets now pricing in a possible rate hike within months, any additional hawkish commentary from Fed officials could pressure Bitcoin lower.
Geopolitical developments surrounding the Iran negotiations will continue to influence risk sentiment. The formal Iran signing scheduled for Friday in Switzerland represents a potential volatility event. If talks progress smoothly and the Strait of Hormuz remains open, risk assets including Bitcoin could benefit. Conversely, any escalation or breakdown in negotiations would likely trigger fresh selling.
Technical factors suggest Bitcoin is approaching oversold conditions on multiple timeframes. Both 15-minute and 4-hour cycles show Williams Percent Range and Commodity Channel Index in oversold zones, indicating potential for short-term rebounds. The narrowing Bollinger Band width suggests an imminent breakout in either direction.
Trading Plan and Strategy
For traders navigating this environment, risk management takes precedence. The current market structure suggests maintaining tight stops of 1 to 2 percent and waiting for clear breakouts before establishing significant positions.
A bullish scenario would require Bitcoin to reclaim 65,000 dollars with conviction, ideally accompanied by expanding volume. Such a move would target 67,000 dollars initially, with 70,000 dollars representing the key level for trend reversal confirmation.
A bearish extension would be confirmed by a breakdown below 62,000 dollars, potentially opening the door to 60,000 dollars and possibly 58,000 dollars. Traders should watch the 62,260 dollars level closely, as the 200-week moving average has historically provided substantial support.
Range-bound strategies may be appropriate given the current uncertainty. Trading the range between 62,000 dollars and 65,000 dollars with clear stop losses outside these boundaries could capture short-term moves while limiting downside exposure.
Conclusion
Bitcoin's decline from 67,000 dollars to 62,350 dollars reflects a complex interplay of geopolitical uncertainty, inflation concerns, and shifting monetary policy expectations. While the Iran talks concluded with a preliminary agreement, the messy reality of implementation and ongoing tensions around the Strait of Hormuz have limited the positive impact on crypto markets.
The Federal Reserve's hawkish pivot under Chairman Kevin Warsh has introduced fresh uncertainty about the path of interest rates, with markets now contemplating rate hikes rather than cuts. This shift in monetary policy expectations has weighed on risk assets broadly.
The week ahead will be pivotal. Traders should monitor the 62,000 dollars to 62,260 dollars support zone closely, as a breakdown could accelerate selling toward 60,000 dollars. Conversely, a reclaim of 65,000 dollars would signal improving conditions and potentially set the stage for a test of 67,000 dollars to 70,000 dollars.
@Gate_Square #FirstRoundOfUSIranTalksConcludes #MyGateTradeStory