【Is ETH stronger than BTC? A comprehensive analysis of key support levels and rebound potential】
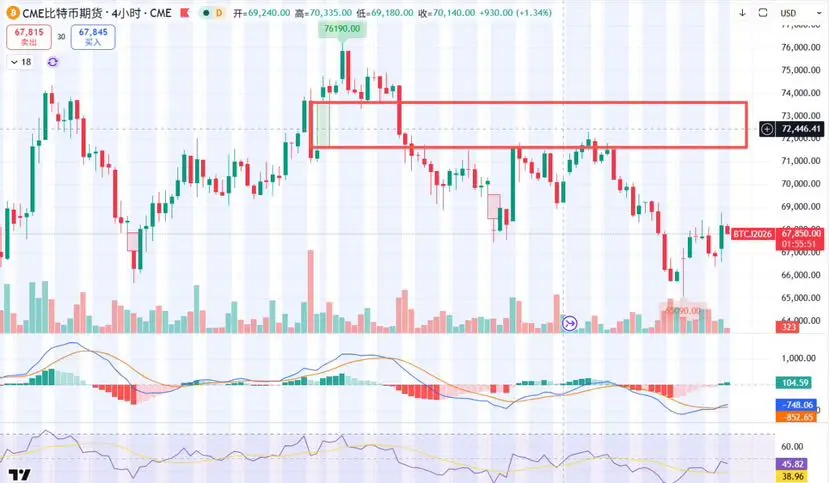
Bitcoin has finally ended its 49-day flag pattern consolidation. When it touched the lower boundary of the flag for the third time, there was no effective resistance. After a brief oscillation, it broke downward, forming a small waterfall decline.
Let's review this market movement, especially the latter half. Each rebound failed to reach important resistance levels, making the market look quite weak. However, influenced by the Iran conflict, the short-term trend is a mix of bulls and bears, changing rapidly, which makes trading quite challenging.
We previously mentioned that a descending flag pattern is meant to be broken downward. The timing is just a matter of when. The overall trend remains bearish, and the current movement aligns with our expectations.
Since the downward flag has been broken, it essentially confirms that this rebound has ended, and the market is returning to a downtrend.
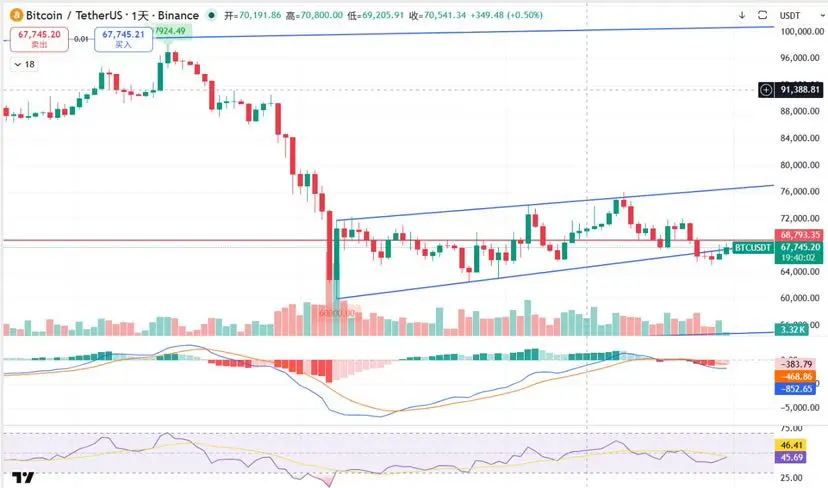
On the daily chart, the MACD has formed a second death cross near the zero line, starting to move below zero into the bearish zone. The pattern looks weak, and the downward momentum is quite strong.
However, I believe it won't continue to fall sharply right away. It will likely oscillate first before heading lower.
There are two reasons: First, Bitcoin is approaching support levels around 64,000 to 65,000, which suggests a rebound is needed. Second, after breaking the descending flag, there is also a reason for a retest to confirm the validity of the breakdown.
But this rebound's initial height is limited, with the first resistance around 67,200. If it can break above and re-enter the flag pattern, there’s a chance to reach 72,000.
Personally, I remain cautious. The probability of encountering resistance at 67,200 and continuing downward is quite high. Be prepared mentally!
Looking further down, the only visible support is the previous low around 60,000. The expectation is that it will break through and dip to the 58,000–59,000 range before rebounding. Once it reaches this zone, the rebound strength should increase significantly. We will analyze specific levels when the price gets there!
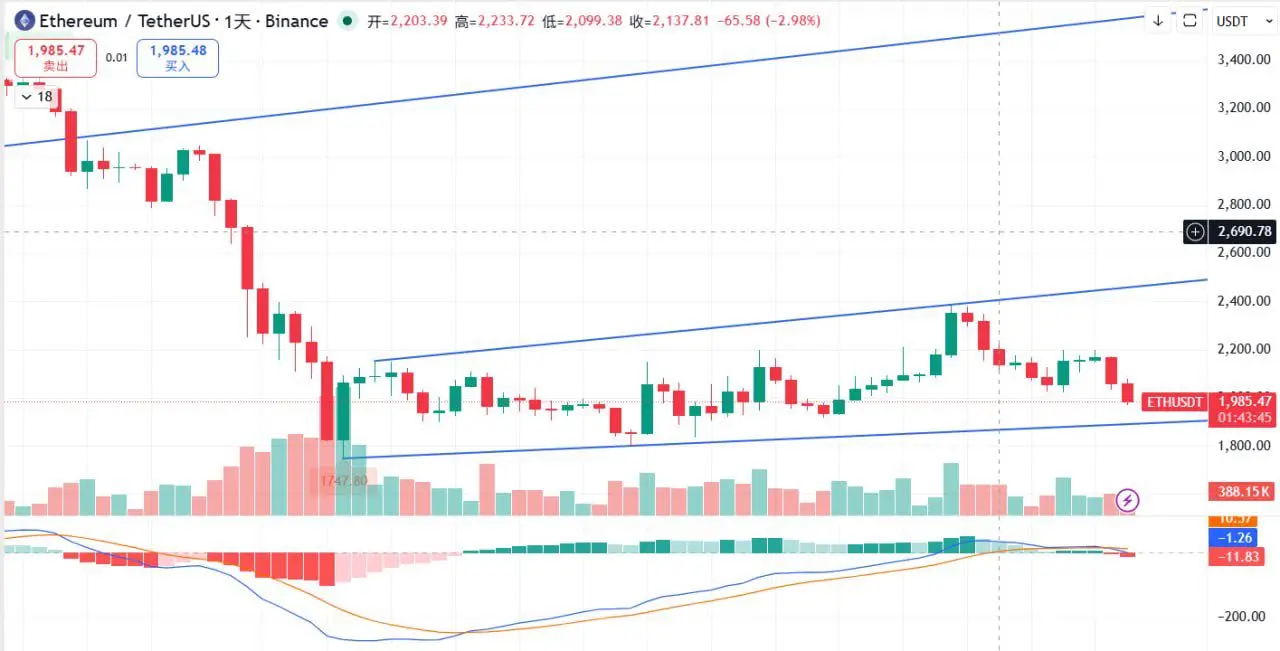
Finally, let's talk about Ethereum. ETH's situation is similar to Bitcoin's, but since the last rebound was very strong, its pattern isn't as weak as Bitcoin's. The major support is around the trend line at 1,900, with potential for no new lows. The rebound is also expected to be stronger than Bitcoin's, with resistance around 2,100.
Trading strategy: The 58,000 level isn't far away—just a few points away. For those holding deep positions, be prepared to hold through. For those looking to add or enter the market, 58,000 is a good entry point for a strong buy.
Bitcoin has finally ended its 49-day flag pattern consolidation. When it touched the lower boundary of the flag for the third time, there was no effective resistance. After a brief oscillation, it broke downward, forming a small waterfall decline.
Let's review this market movement, especially the latter half. Each rebound failed to reach important resistance levels, making the market look quite weak. However, influenced by the Iran conflict, the short-term trend is a mix of bulls and bears, changing rapidly, which makes trading quite challenging.
We previously mentioned that a descending flag pattern is meant to be broken downward. The timing is just a matter of when. The overall trend remains bearish, and the current movement aligns with our expectations.
Since the downward flag has been broken, it essentially confirms that this rebound has ended, and the market is returning to a downtrend.
On the daily chart, the MACD has formed a second death cross near the zero line, starting to move below zero into the bearish zone. The pattern looks weak, and the downward momentum is quite strong.
However, I believe it won't continue to fall sharply right away. It will likely oscillate first before heading lower.
There are two reasons: First, Bitcoin is approaching support levels around 64,000 to 65,000, which suggests a rebound is needed. Second, after breaking the descending flag, there is also a reason for a retest to confirm the validity of the breakdown.
But this rebound's initial height is limited, with the first resistance around 67,200. If it can break above and re-enter the flag pattern, there’s a chance to reach 72,000.
Personally, I remain cautious. The probability of encountering resistance at 67,200 and continuing downward is quite high. Be prepared mentally!
Looking further down, the only visible support is the previous low around 60,000. The expectation is that it will break through and dip to the 58,000–59,000 range before rebounding. Once it reaches this zone, the rebound strength should increase significantly. We will analyze specific levels when the price gets there!
Finally, let's talk about Ethereum. ETH's situation is similar to Bitcoin's, but since the last rebound was very strong, its pattern isn't as weak as Bitcoin's. The major support is around the trend line at 1,900, with potential for no new lows. The rebound is also expected to be stronger than Bitcoin's, with resistance around 2,100.
Trading strategy: The 58,000 level isn't far away—just a few points away. For those holding deep positions, be prepared to hold through. For those looking to add or enter the market, 58,000 is a good entry point for a strong buy.