Trade
Basic
Futures
Futures
Hundreds of contracts settled in USDT or BTC
TradFi
Gold
Trade global traditional assets with USDT in one place
Options
Hot
Trade European-style vanilla options
Unified Account
Maximize your capital efficiency
Demo Trading
Futures Kickoff
Get prepared for your futures trading
Futures Events
Participate in events to win generous rewards
Demo Trading
Use virtual funds to experience risk-free trading
Earn
Launch
CandyDrop
Collect candies to earn airdrops
Launchpool
Quick staking, earn potential new tokens
HODLer Airdrop
Hold GT and get massive airdrops for free
Launchpad
Be early to the next big token project
Alpha Points
Trade on-chain assets and enjoy airdrop rewards!
Futures Points
Earn futures points and claim airdrop rewards
Investment
Simple Earn
Earn interests with idle tokens
Auto-Invest
Auto-invest on a regular basis
Dual Investment
Buy low and sell high to take profits from price fluctuations
Soft Staking
Earn rewards with flexible staking
Crypto Loan
0 Fees
Pledge one crypto to borrow another
Lending Center
One-stop lending hub
VIP Wealth Hub
Customized wealth management empowers your assets growth
Private Wealth Management
Customized asset management to grow your digital assets
Quant Fund
Top asset management team helps you profit without hassle
Staking
Stake cryptos to earn in PoS products
Smart Leverage
New
No forced liquidation before maturity, worry-free leveraged gains
GUSD Minting
Use USDT/USDC to mint GUSD for treasury-level yields
More
LianCeStudySociety-BrotherJing
No content yet
LianceStudySociety-BrotherJing
 0
0
#白宫加密会议 Background: Cryptocurrency has grown into a trillion-dollar ecosystem, but the US faces challenges such as fragmented regulation, uncertain compliance, and market volatility. The White House Cryptocurrency Summit marks a key turning point for the industry.
Core impacts:
- Regulatory side: Clarify asset classifications, standardize compliance processes, resolve conflicts among multiple regulatory agencies, and clear obstacles for innovations like NFTs, DeFi, and stablecoins.
- Market side: Promote institutional adoption (bank custody, ETF approvals, diversified corporate treasuries), en
View OriginalCore impacts:
- Regulatory side: Clarify asset classifications, standardize compliance processes, resolve conflicts among multiple regulatory agencies, and clear obstacles for innovations like NFTs, DeFi, and stablecoins.
- Market side: Promote institutional adoption (bank custody, ETF approvals, diversified corporate treasuries), en
MC:$3.39KHolders:1
0.00%
- Reward
- like
- Comment
- Repost
- Share
What was your income level in ancient times? Working hard every day just for a few taels of silver!
Now, silver costs 35 yuan per gram. My monthly salary is 100 grams🤪. An ancient maidservant earned 2 taels of silver a month, including food and accommodation!#贵金属巨震 $XAG $XAU
Now, silver costs 35 yuan per gram. My monthly salary is 100 grams🤪. An ancient maidservant earned 2 taels of silver a month, including food and accommodation!#贵金属巨震 $XAG $XAU
View Original

MC:$3.45KHolders:2
0.04%
- Reward
- like
- Comment
- Repost
- Share
BTC/USDT 1-Hour Market Analysis and Long/Short Strategies
1. Current Market Interpretation
1. Price and Bollinger Bands
Current price: 78,474.95 USDT, is between the middle band (77,928.78) and the upper band (79,716.06). This indicates short-term market sentiment is bullish, and the price is testing the upper band resistance.
2. Support and Resistance
- Support Level: The middle Bollinger Band at 77,928.78 USDT is a key support, with a previous low at 74,604.00 USDT below.
- Resistance Level: The upper Bollinger Band at 79,716.06 USDT is the first resistance, with higher resistance at 80,585.
BTC2.15%

MC:$3.33KHolders:1
0.00%
- Reward
- like
- Comment
- Repost
- Share
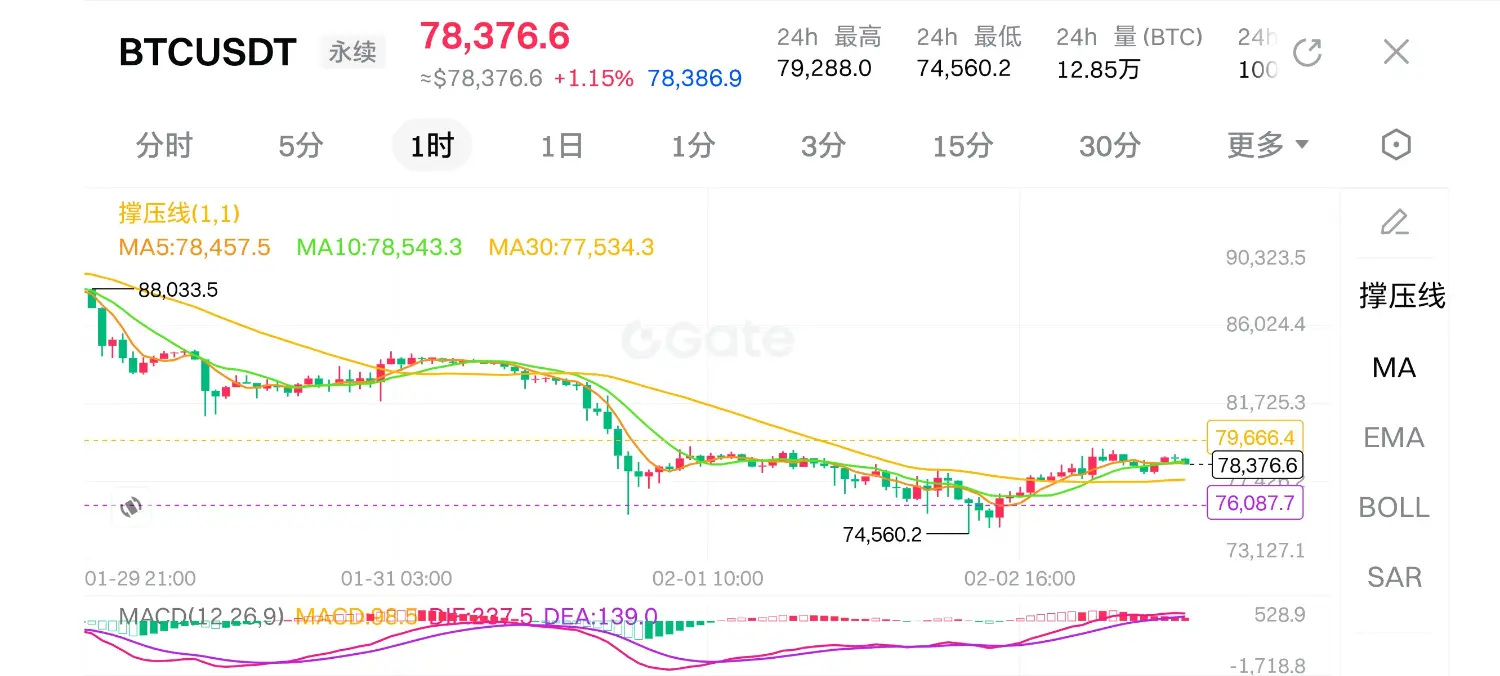
BTC/USDT 1-Hour Market Analysis and Long-Short Strategy
1. Market Status
- Current Price: 77,951.15 USDT, down 1.15% over 24 hours.
- Price has just rebounded from the recent low of 75,700, currently near the middle band of the Bollinger Bands (77,937.46), almost coinciding with the middle band.
- Trading volume has increased during the recent rebound, indicating capital inflow, but key resistance levels have not yet been broken.
- The Bollinger Bands remain generally opening downward, suggesting the medium-term bearish pattern persists, but there are signs of short-term stabilization.
2. Long
BTC2.15%


MC:$3.33KHolders:1
0.00%
- Reward
- like
- Comment
- Repost
- Share
#加密市场回调 Nasdaq-listed company Tron purchases an additional 173,051 #TRX tokens
Nasdaq-listed company Tron announced on X platform that it has repurchased 173,051 TRX tokens at an average price of $0.29, further increasing its TRX treasury holdings to over 679.2 million tokens.
The company plans to further increase its Tron DAT holdings to enhance long-term value for shareholders. $TRX
TRX-0.13%


MC:$3.24KHolders:1
0.00%
- Reward
- 3
- Comment
- Repost
- Share
Remember the legendary filmmaker: Mr. Wu Ma?
The 2026 Bing Wu Year Zodiac Auspicious Coin, anchored to the 2026 Year of the Horse zodiac symbol, also pays tribute to the craftsmanship and passion of the film pioneer Wu Ma. Centered on Eastern zodiac culture, integrating cinematic sentiment into the crypto ecosystem, and promoting decentralized community governance, so that every coin holder's consensus becomes a dual inheritance of the Dragon Horse spirit and the original intention of light and shadow. #加密市场观察
View OriginalThe 2026 Bing Wu Year Zodiac Auspicious Coin, anchored to the 2026 Year of the Horse zodiac symbol, also pays tribute to the craftsmanship and passion of the film pioneer Wu Ma. Centered on Eastern zodiac culture, integrating cinematic sentiment into the crypto ecosystem, and promoting decentralized community governance, so that every coin holder's consensus becomes a dual inheritance of the Dragon Horse spirit and the original intention of light and shadow. #加密市场观察


MC:$3.22KHolders:1
0.00%
- Reward
- like
- 2
- Repost
- Share
LianceStudySociety-BrotherJing:
New Year Wealth Explosion 🤑View More
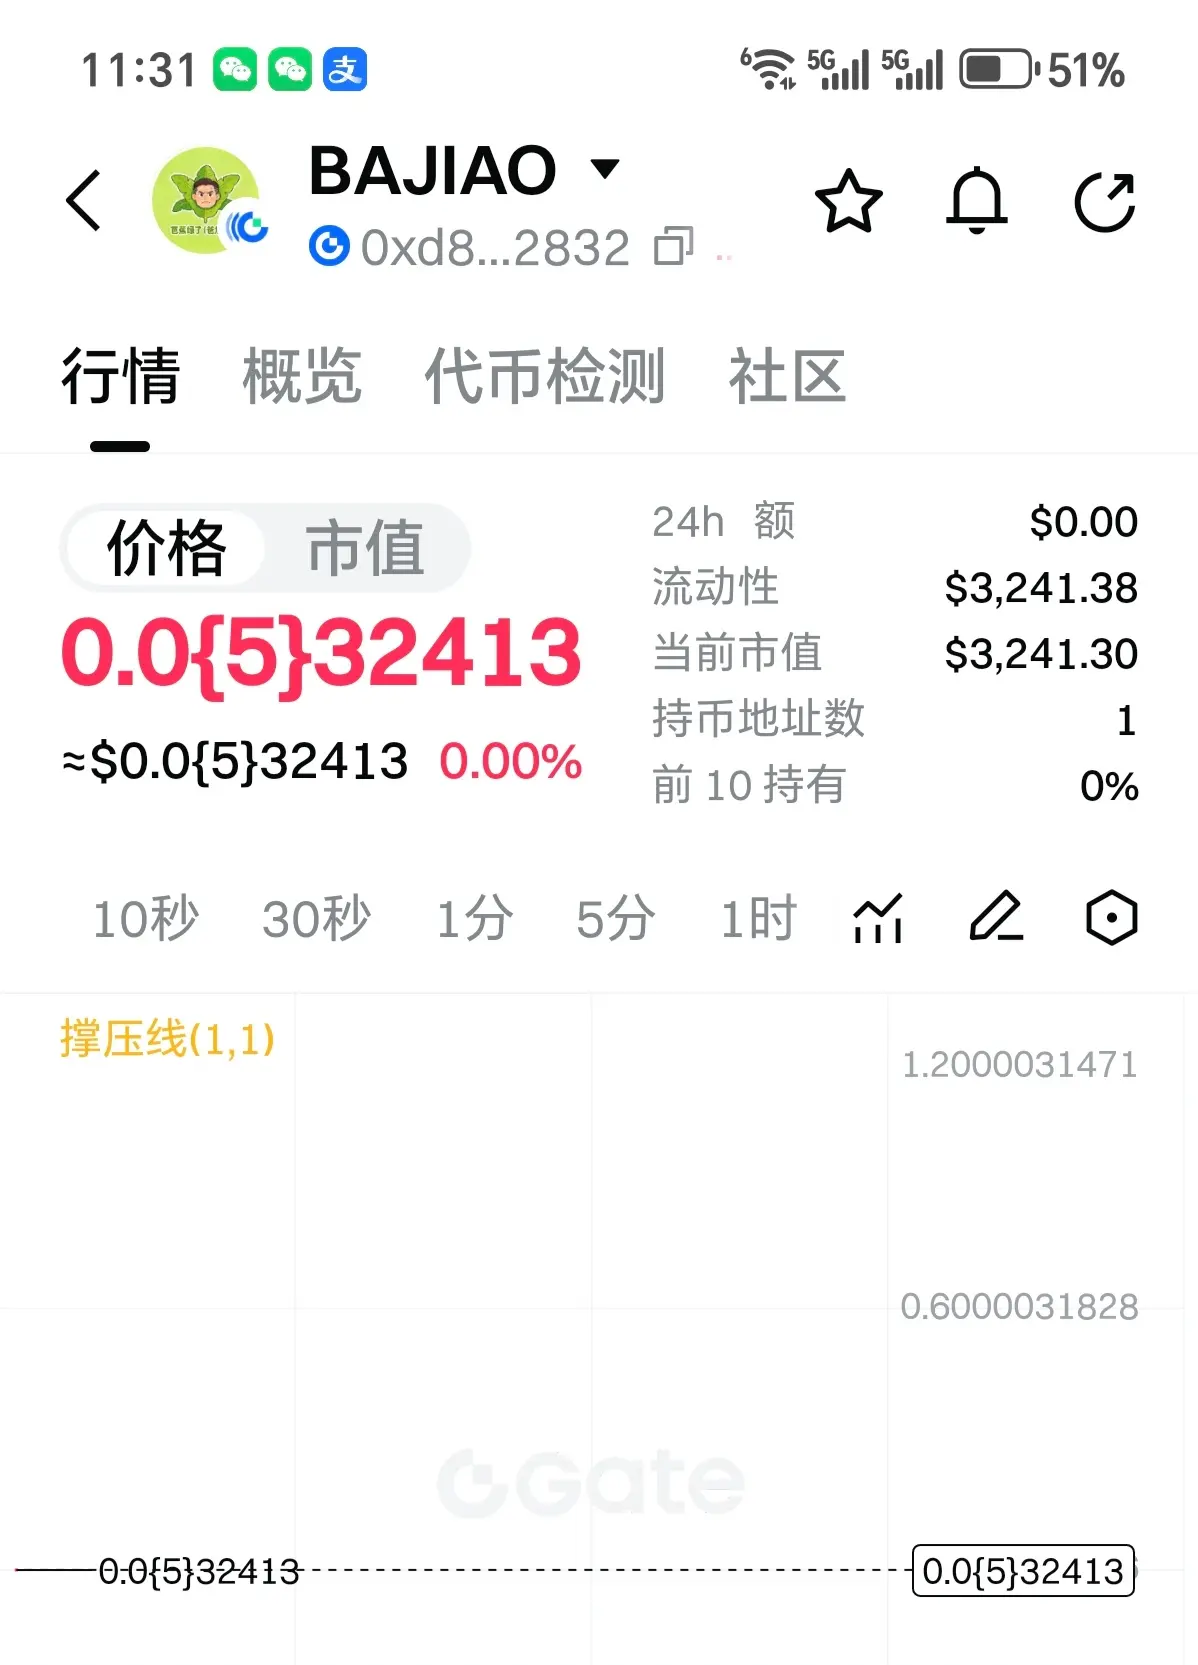
Found an interesting new coin: Banana Green
$BAJIAO, a fun Meme coin with the pun "Dad is anxious," anchored to mass emotional resonance, creating a lightweight and fun crypto community. No complicated rules, using relaxed meme linking consensus, backed by community governance, allowing every holder to unlock both emotional and value resonance in the crypto wave. #加密市场观察 freshly released, at the bottom price, do you think it can be pumped up?
View Original$BAJIAO, a fun Meme coin with the pun "Dad is anxious," anchored to mass emotional resonance, creating a lightweight and fun crypto community. No complicated rules, using relaxed meme linking consensus, backed by community governance, allowing every holder to unlock both emotional and value resonance in the crypto wave. #加密市场观察 freshly released, at the bottom price, do you think it can be pumped up?

MC:$3.24KHolders:1
0.00%
- Reward
- like
- 1
- Repost
- Share
LianceStudySociety-BrotherJing:
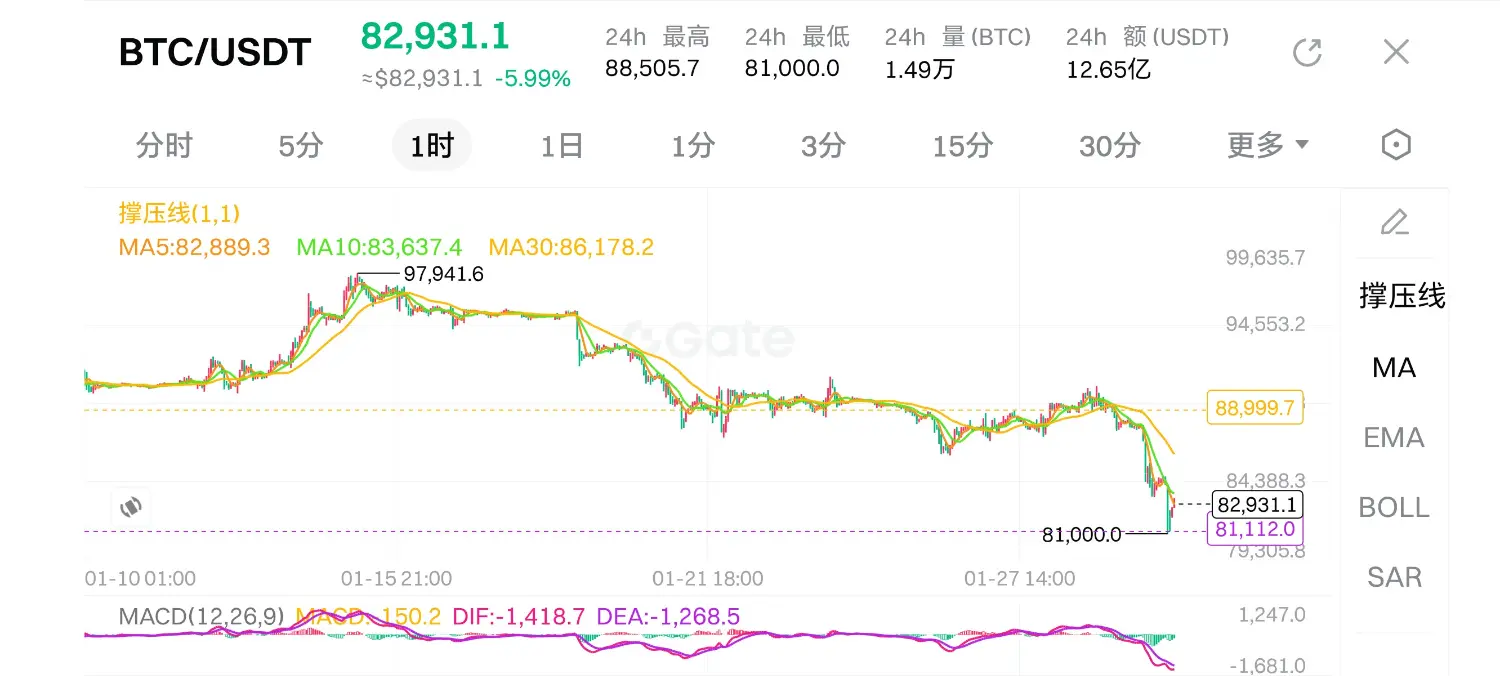
Hop on board!🚗BTC/USDT 1-Hour Level Bull and Bear Strategy Analysis
1. Trends, Support, and Resistance
- The price rapidly declined from a high of $90,600, currently at $83,043.35, a 24-hour decrease of 5.71%.
- The price has broken below the middle band of the Bollinger Bands (85,066.83 USD) and briefly touched the lower band (81,128.05 USD) at a low of 81,118 USD, indicating short-term weakness.
- Key support levels: $81,100-$81,500 (lower band and intraday low)
- Key resistance levels: $85,000-$86,000 (Bollinger Band middle line, previous consolidation platform)
2. Bollinger Bands Indicator
- The Bolling
BTC2.15%
MC:$3.33KHolders:1
0.00%
- Reward
- like
- Comment
- Repost
- Share
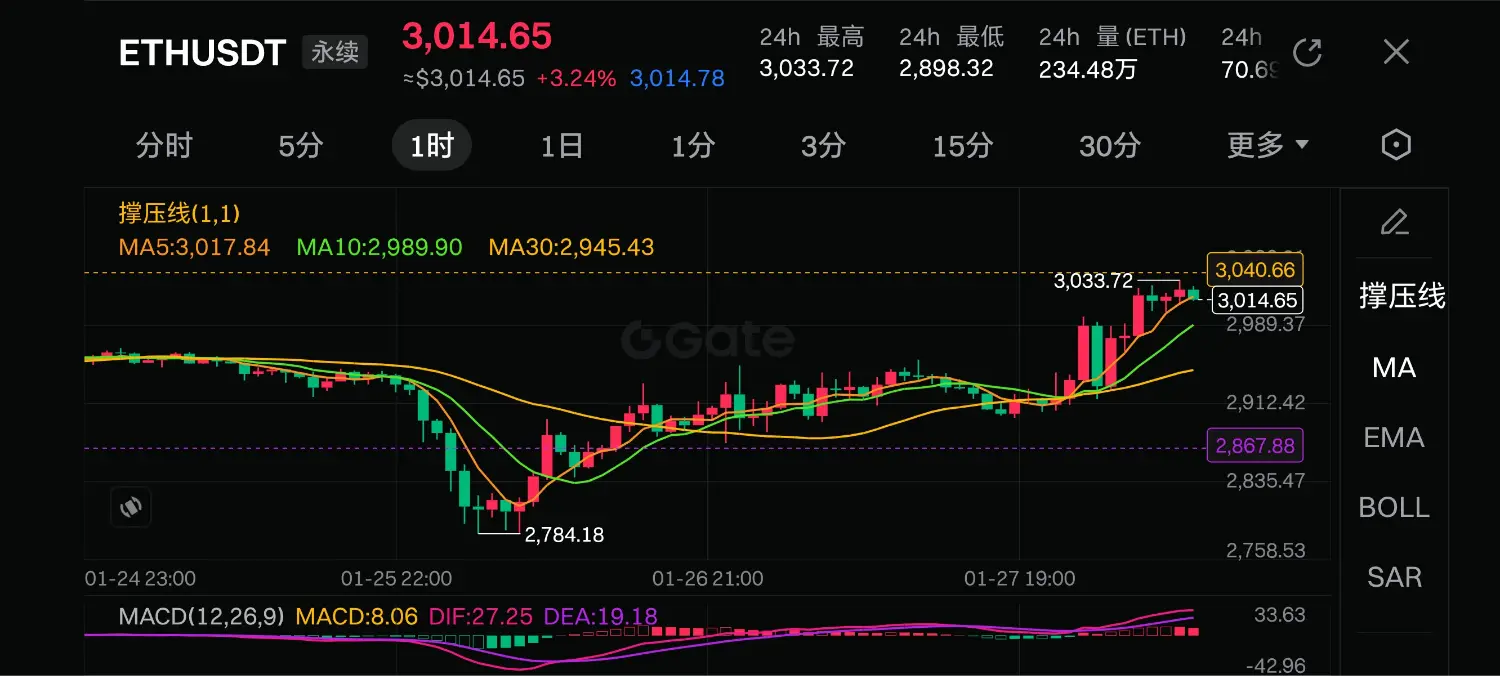
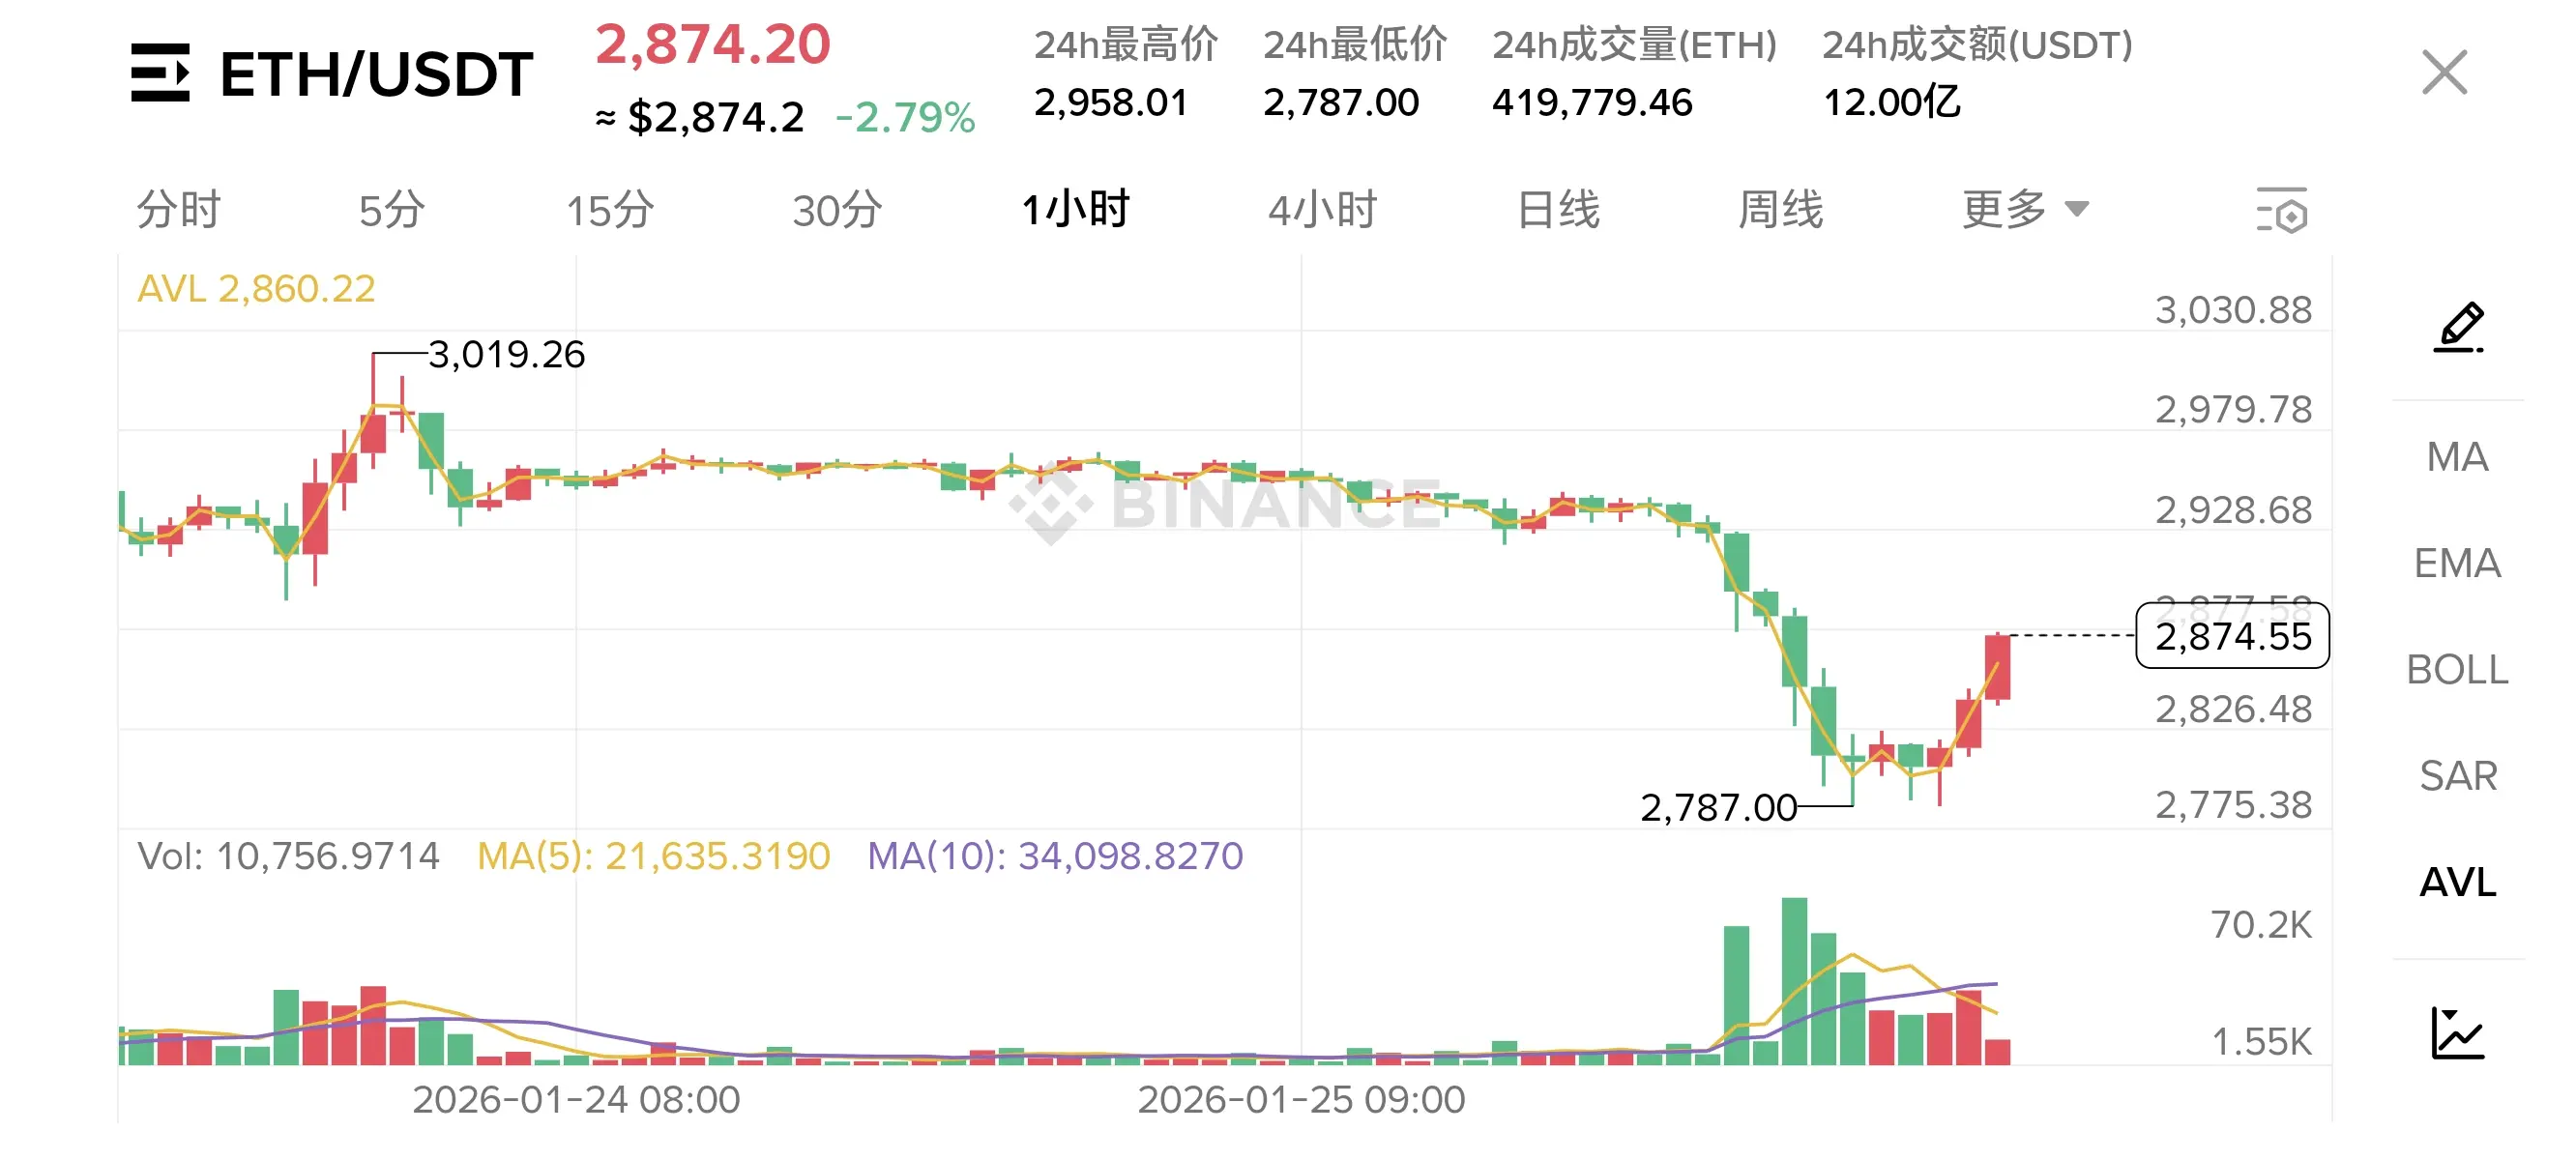
January 28, ETH 1-Hour Market Overview and Trading Strategies
Currently, ETH is priced at $3,018.10, in a rebound phase with bullish momentum dominating.
- Moving Averages: The price has broken above the 5-day, 10-day, and 20-day moving averages, with the short-term (5-day) moving average crossing above the medium- and long-term averages, forming a bullish alignment, indicating a short-term upward trend.
- Support and Resistance: Support levels are at 2,990 (10-day MA) and 2,954 (20-day MA); resistance levels are at 3,033 (24-hour high) and 3,075 (previous key resistance).
- Volume: Recent tra
ETH2.65%

MC:$3.45KHolders:2
0.04%
- Reward
- like
- Comment
- Repost
- Share
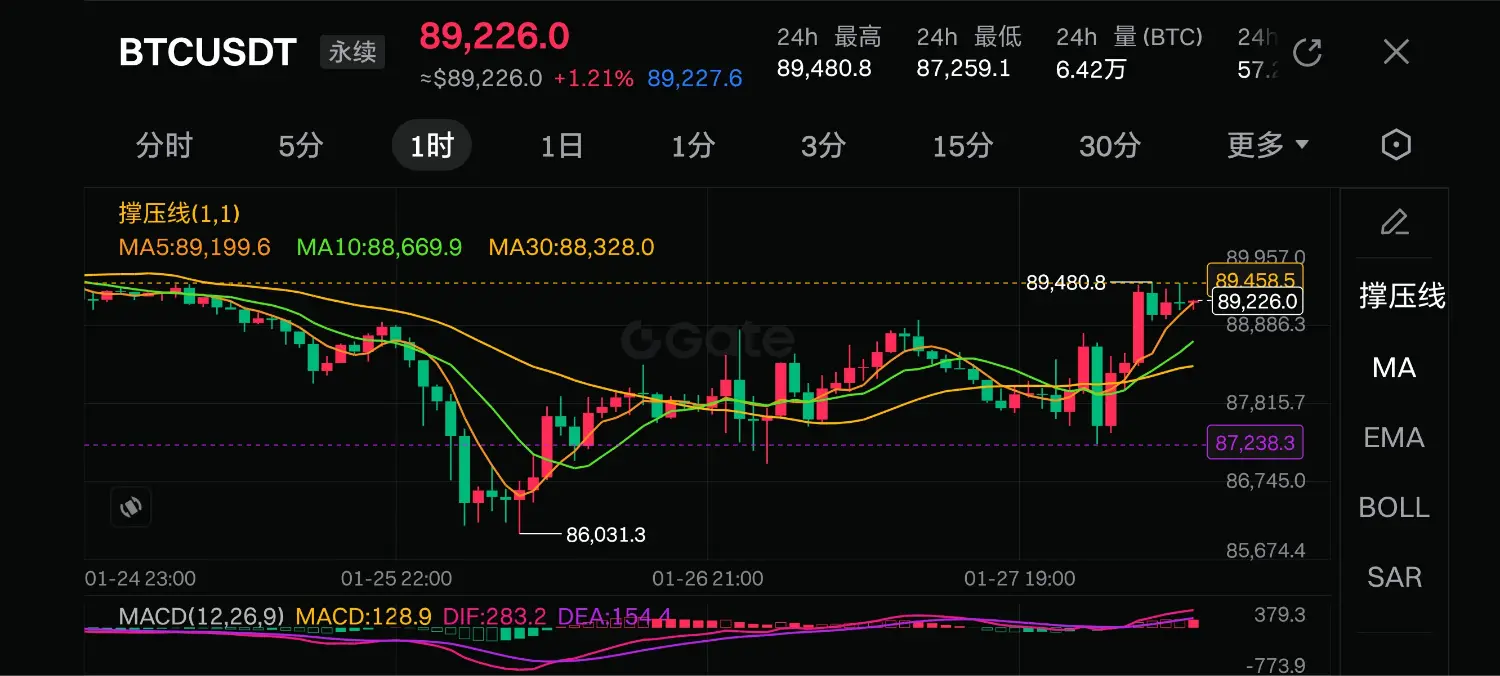
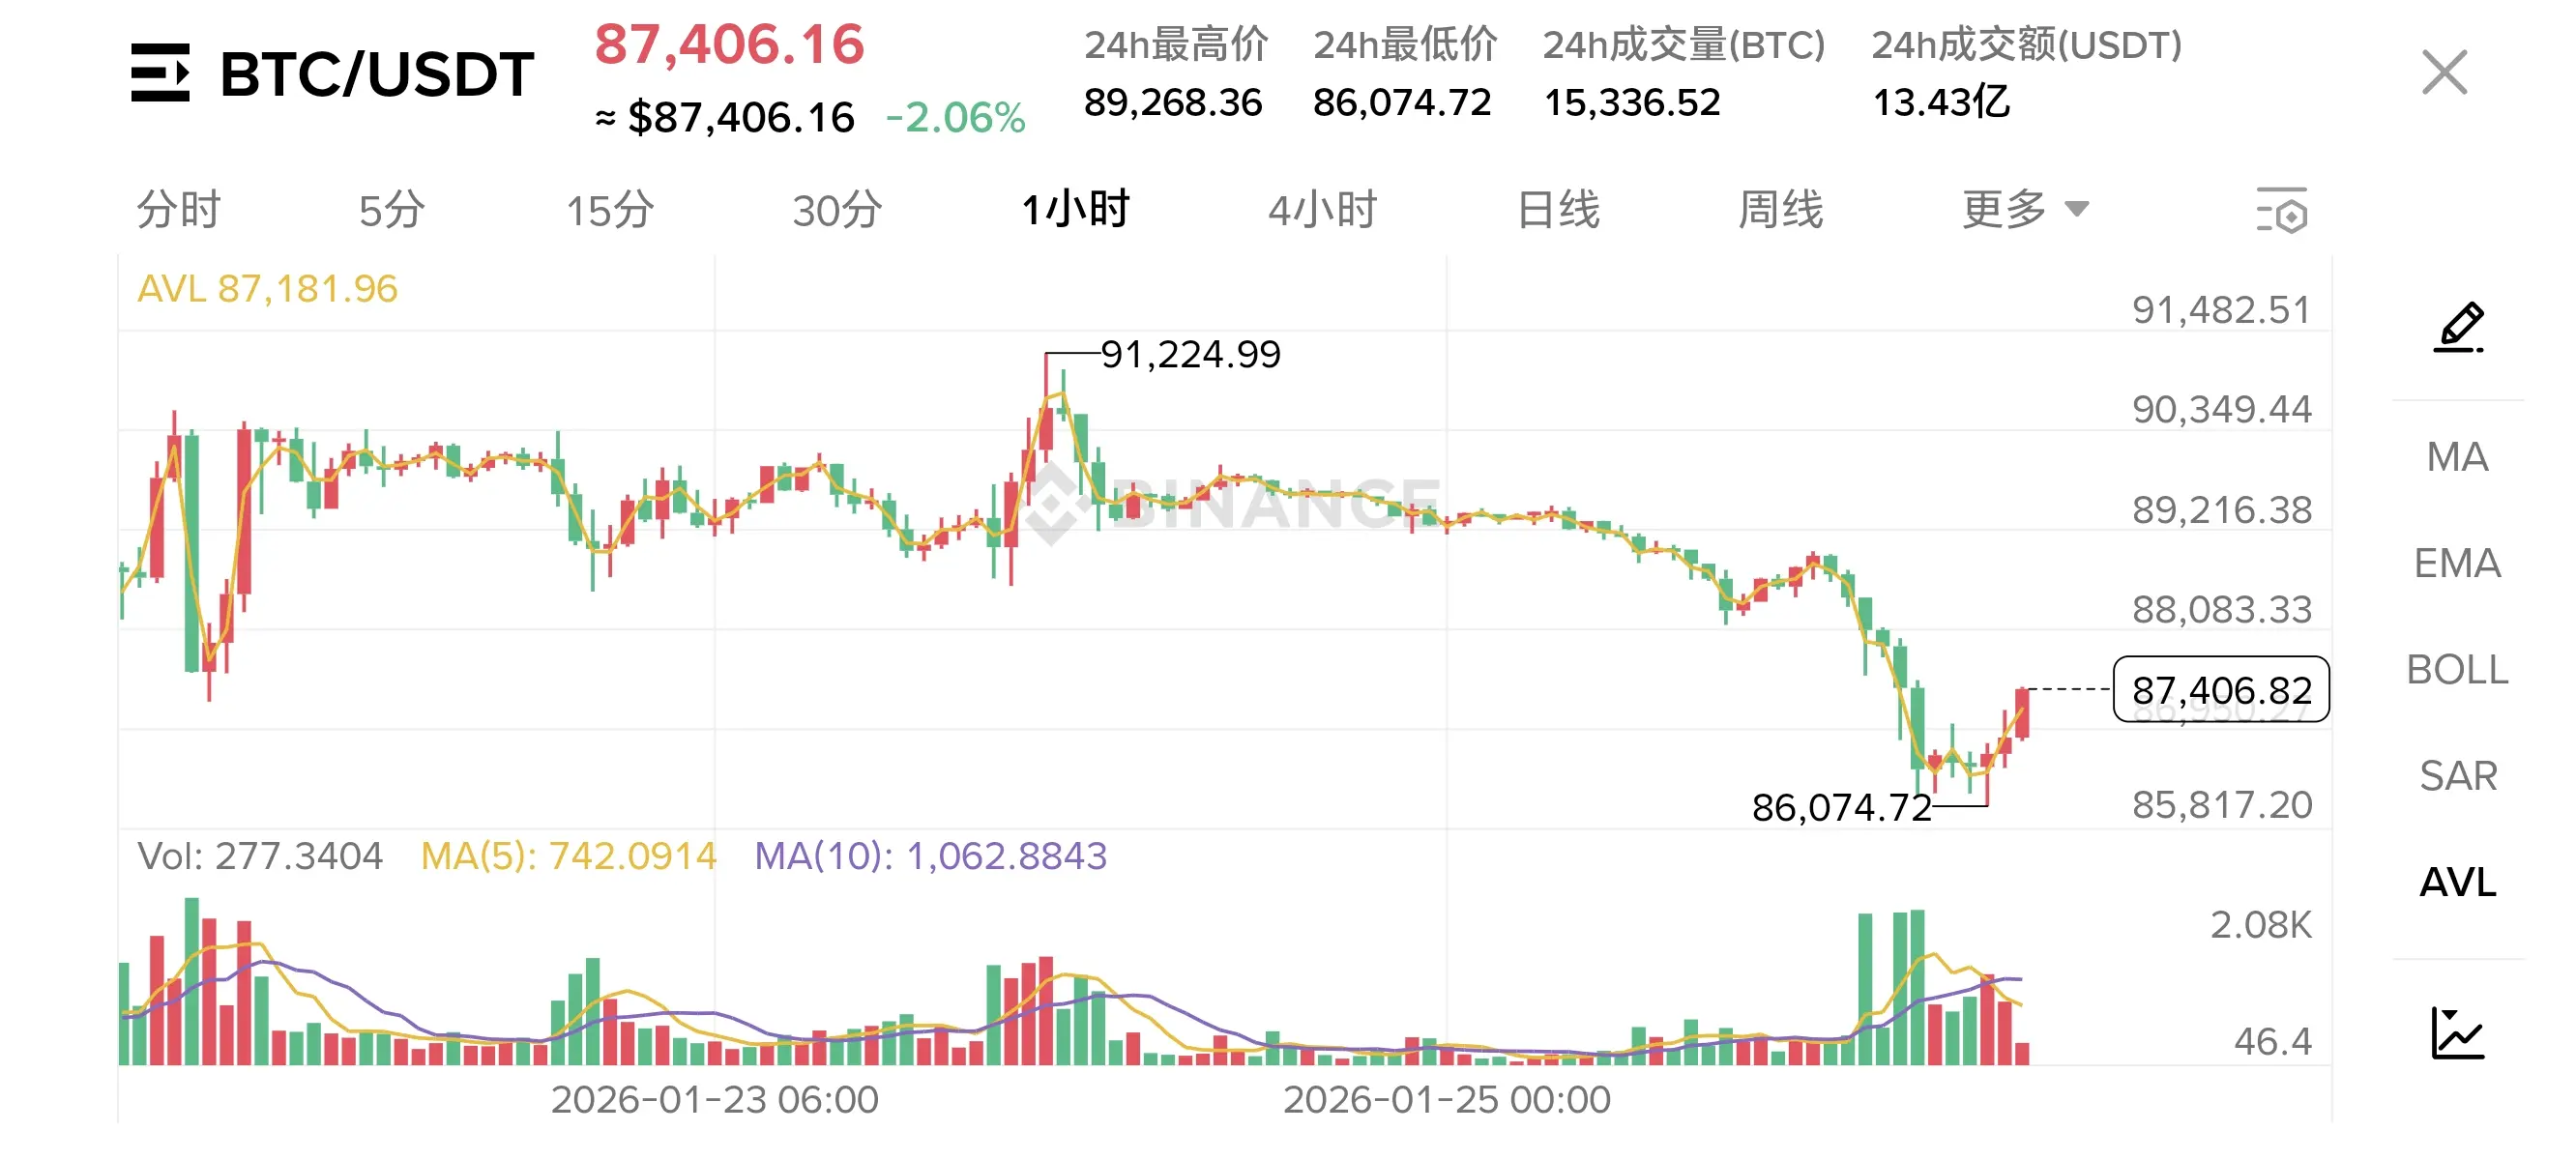
January 28th, BTC Market Analysis and Trading Strategy
The current price is oscillating and rebounding between the middle and upper Bollinger Bands, showing a short-term bullish bias, but there is resistance at the upper band and previous high, with insufficient volume.
Support levels: 88,387 (middle band), 87,284 (lower band)
Resistance levels: 89,490 (upper band), 91,224 (previous high)
Simplified Long and Short Strategies
Long Strategy:
- Pullback Long Entry: Enter at 88,300–88,500, stop loss at 87,800, take profit at 90,500/91,200
- Breakout Long Entry: Enter at 89,500–89,600, stop loss at
BTC2.15%

MC:$3.45KHolders:2
0.04%
- Reward
- 2
- 3
- Repost
- Share
Mehdi850:
hello my friend good luckView More
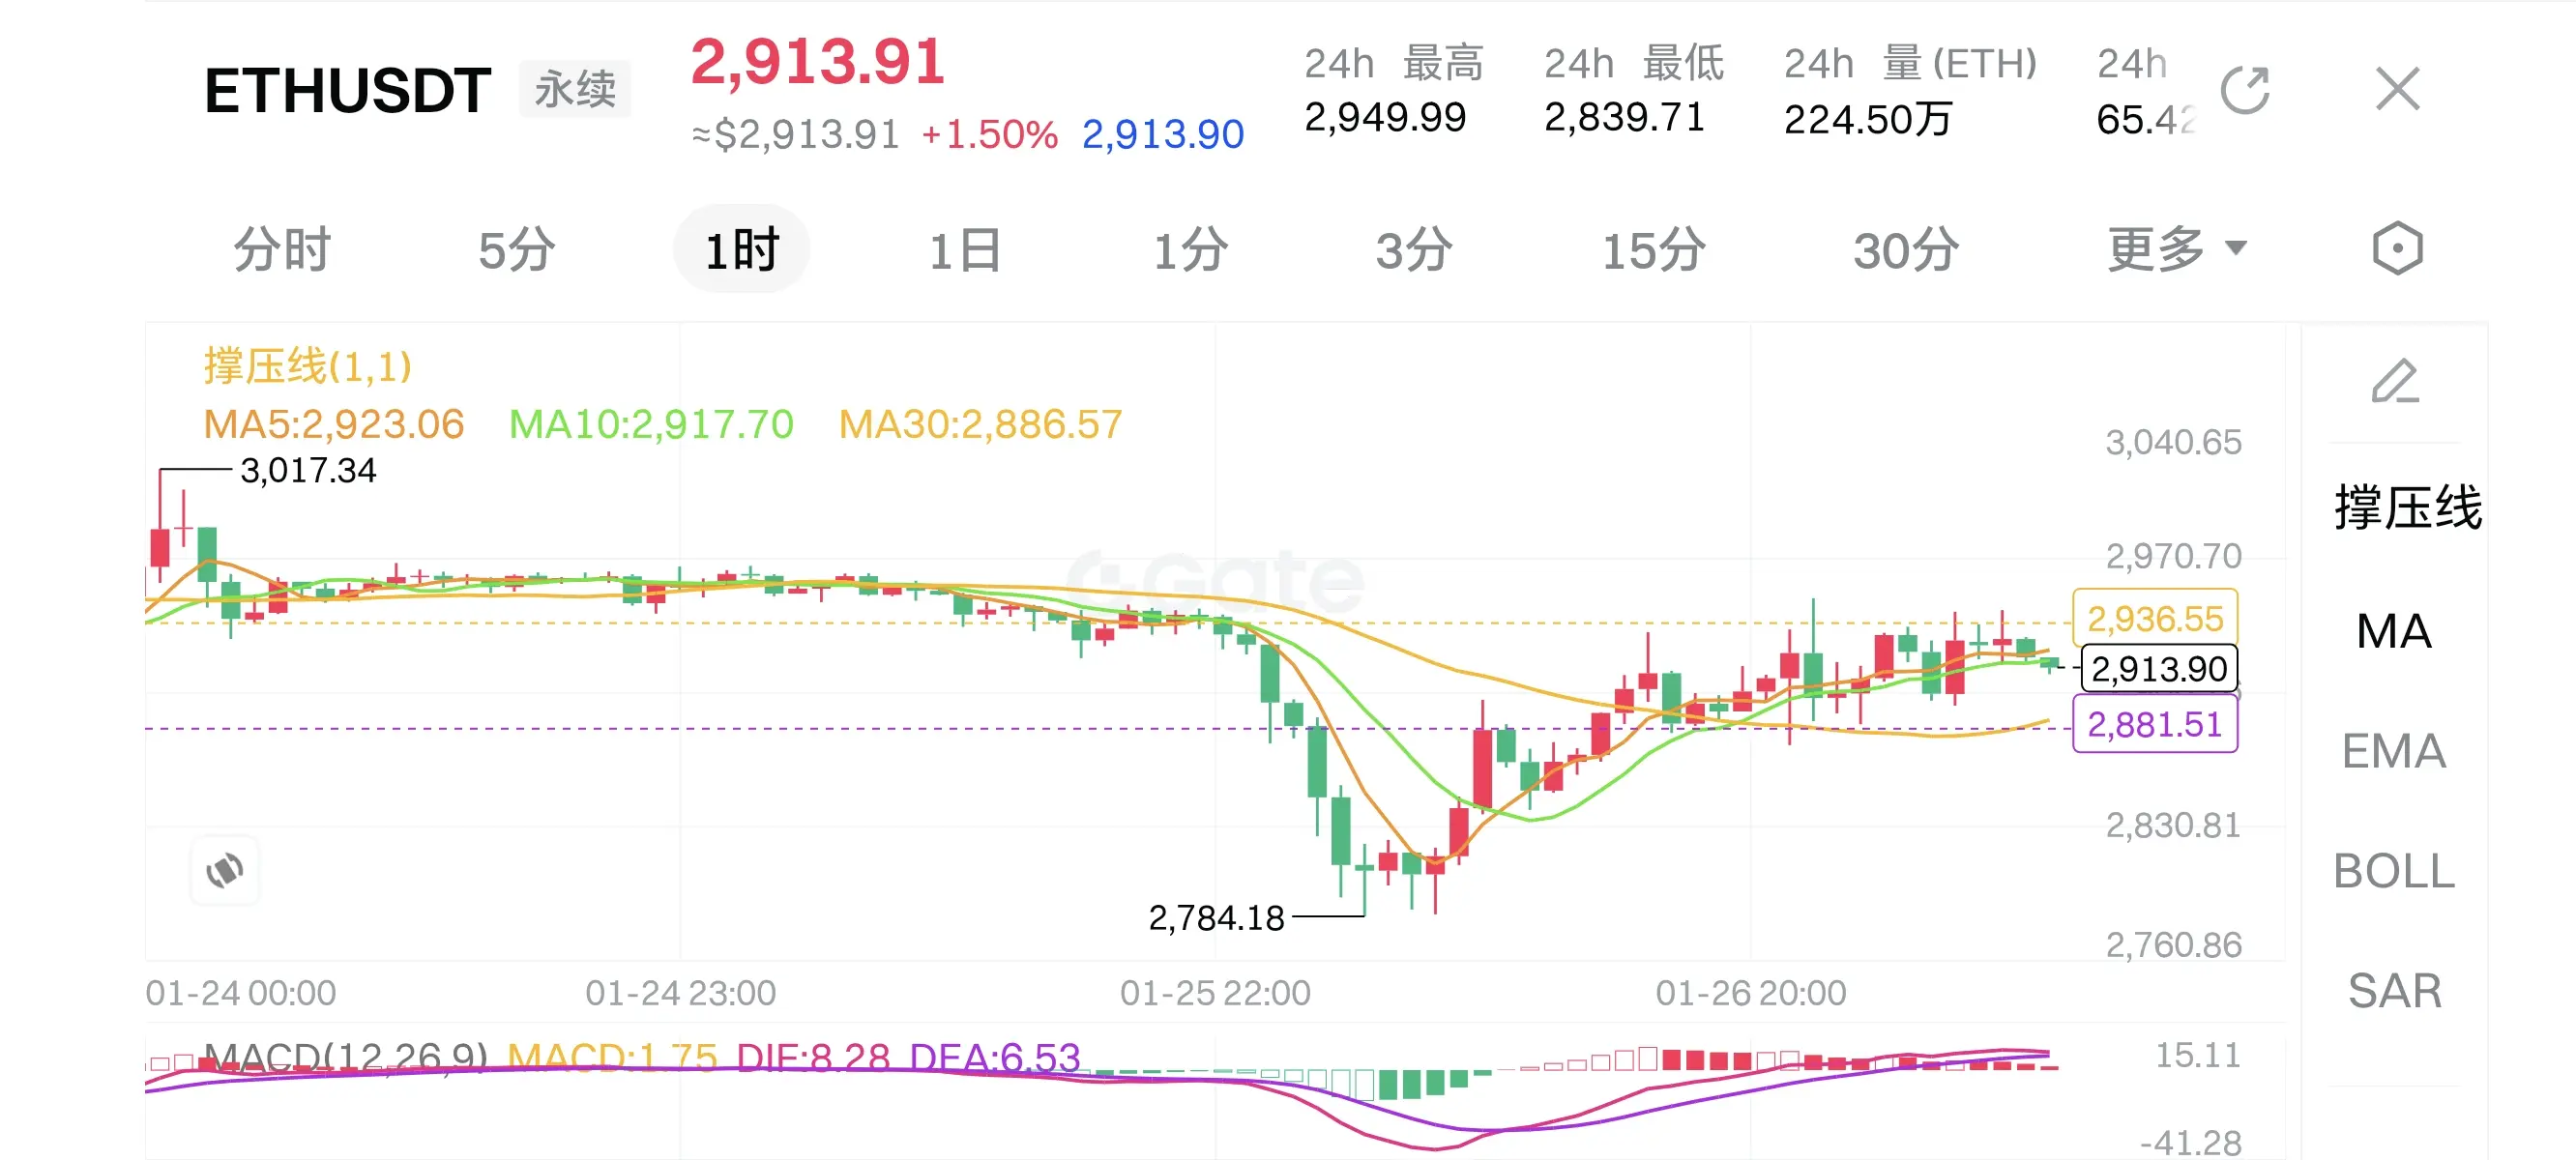
January 27, $ETH 1-Hour Long-Short Strategy
Currently, ETH price is $2919.63, positioned between the middle band (2908.03) and the upper band (2940.60) of the Bollinger Bands, indicating a short-term bullish bias. However, the upper band and the previous high of 2968.49 are under pressure, with the middle band serving as a key support.
🎯 Long-Short Strategy Summary
🔼 Bullish
- Conservative: Wait for a pullback to 2900–2910 and enter once stabilized
- Take Profit: 2940 → 2968
- Stop Loss: 2890
- Breakout: Increase volume and break above 2940.60 to go long
- Take Profit: 3000
- Stop Loss: 292
ETH2.65%

MC:$3.33KHolders:1
0.00%
- Reward
- like
- 1
- Repost
- Share
Talveer:
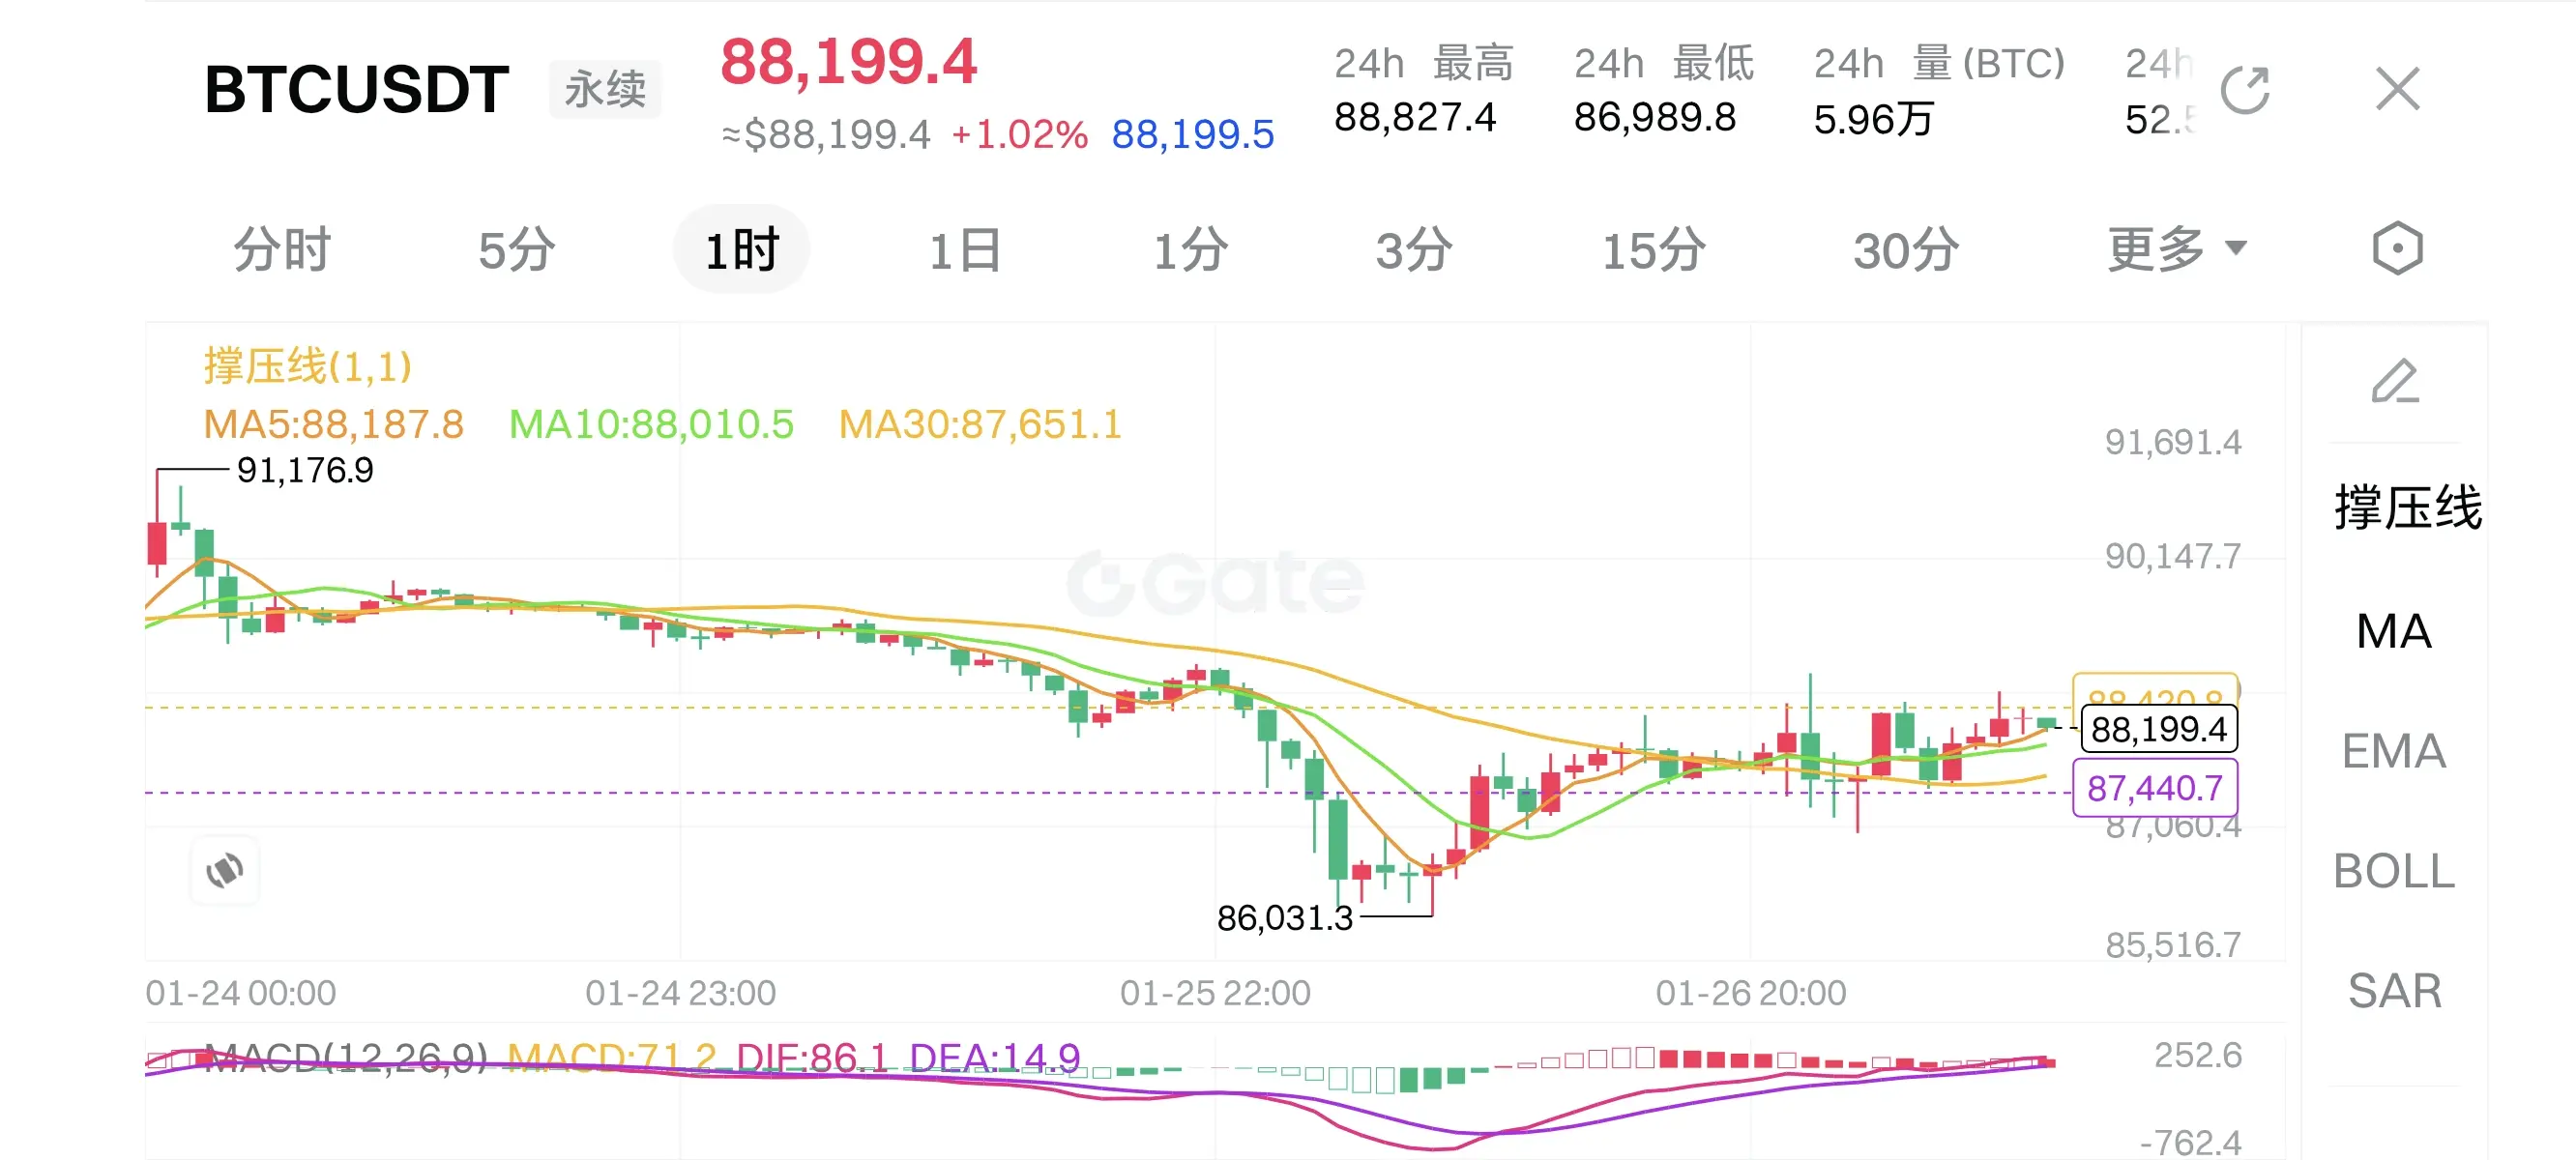
Nice post THANKS FOR POSTING VALUABLE CONTENT. THIS IS VERY INFORMATIVE FOR US KEEP UPDATING USJanuary 27, $BTC 1-Hour Chart and Long/Short Strategies
The current price is between the middle and upper bands of the Bollinger Bands, indicating a short-term bullish bias, but the upper band and previous highs are under pressure. The middle band is a key support level.
🎯 Long/Short Strategy Summary
🔼 Long
- Conservative: Wait for a pullback to 87,900–88,000 and enter once stabilized
- Take Profit: 88,400 → 91,200
- Stop Loss: 87,500
- Breakout: Volume breakout above 88,426 to chase long positions
- Take Profit: 90,000
- Stop Loss: 88,000
🔽 Short
- Resistance: Enter on hesitation near 8
BTC2.15%

MC:$3.45KHolders:2
0.04%
- Reward
- 1
- Comment
- Repost
- Share
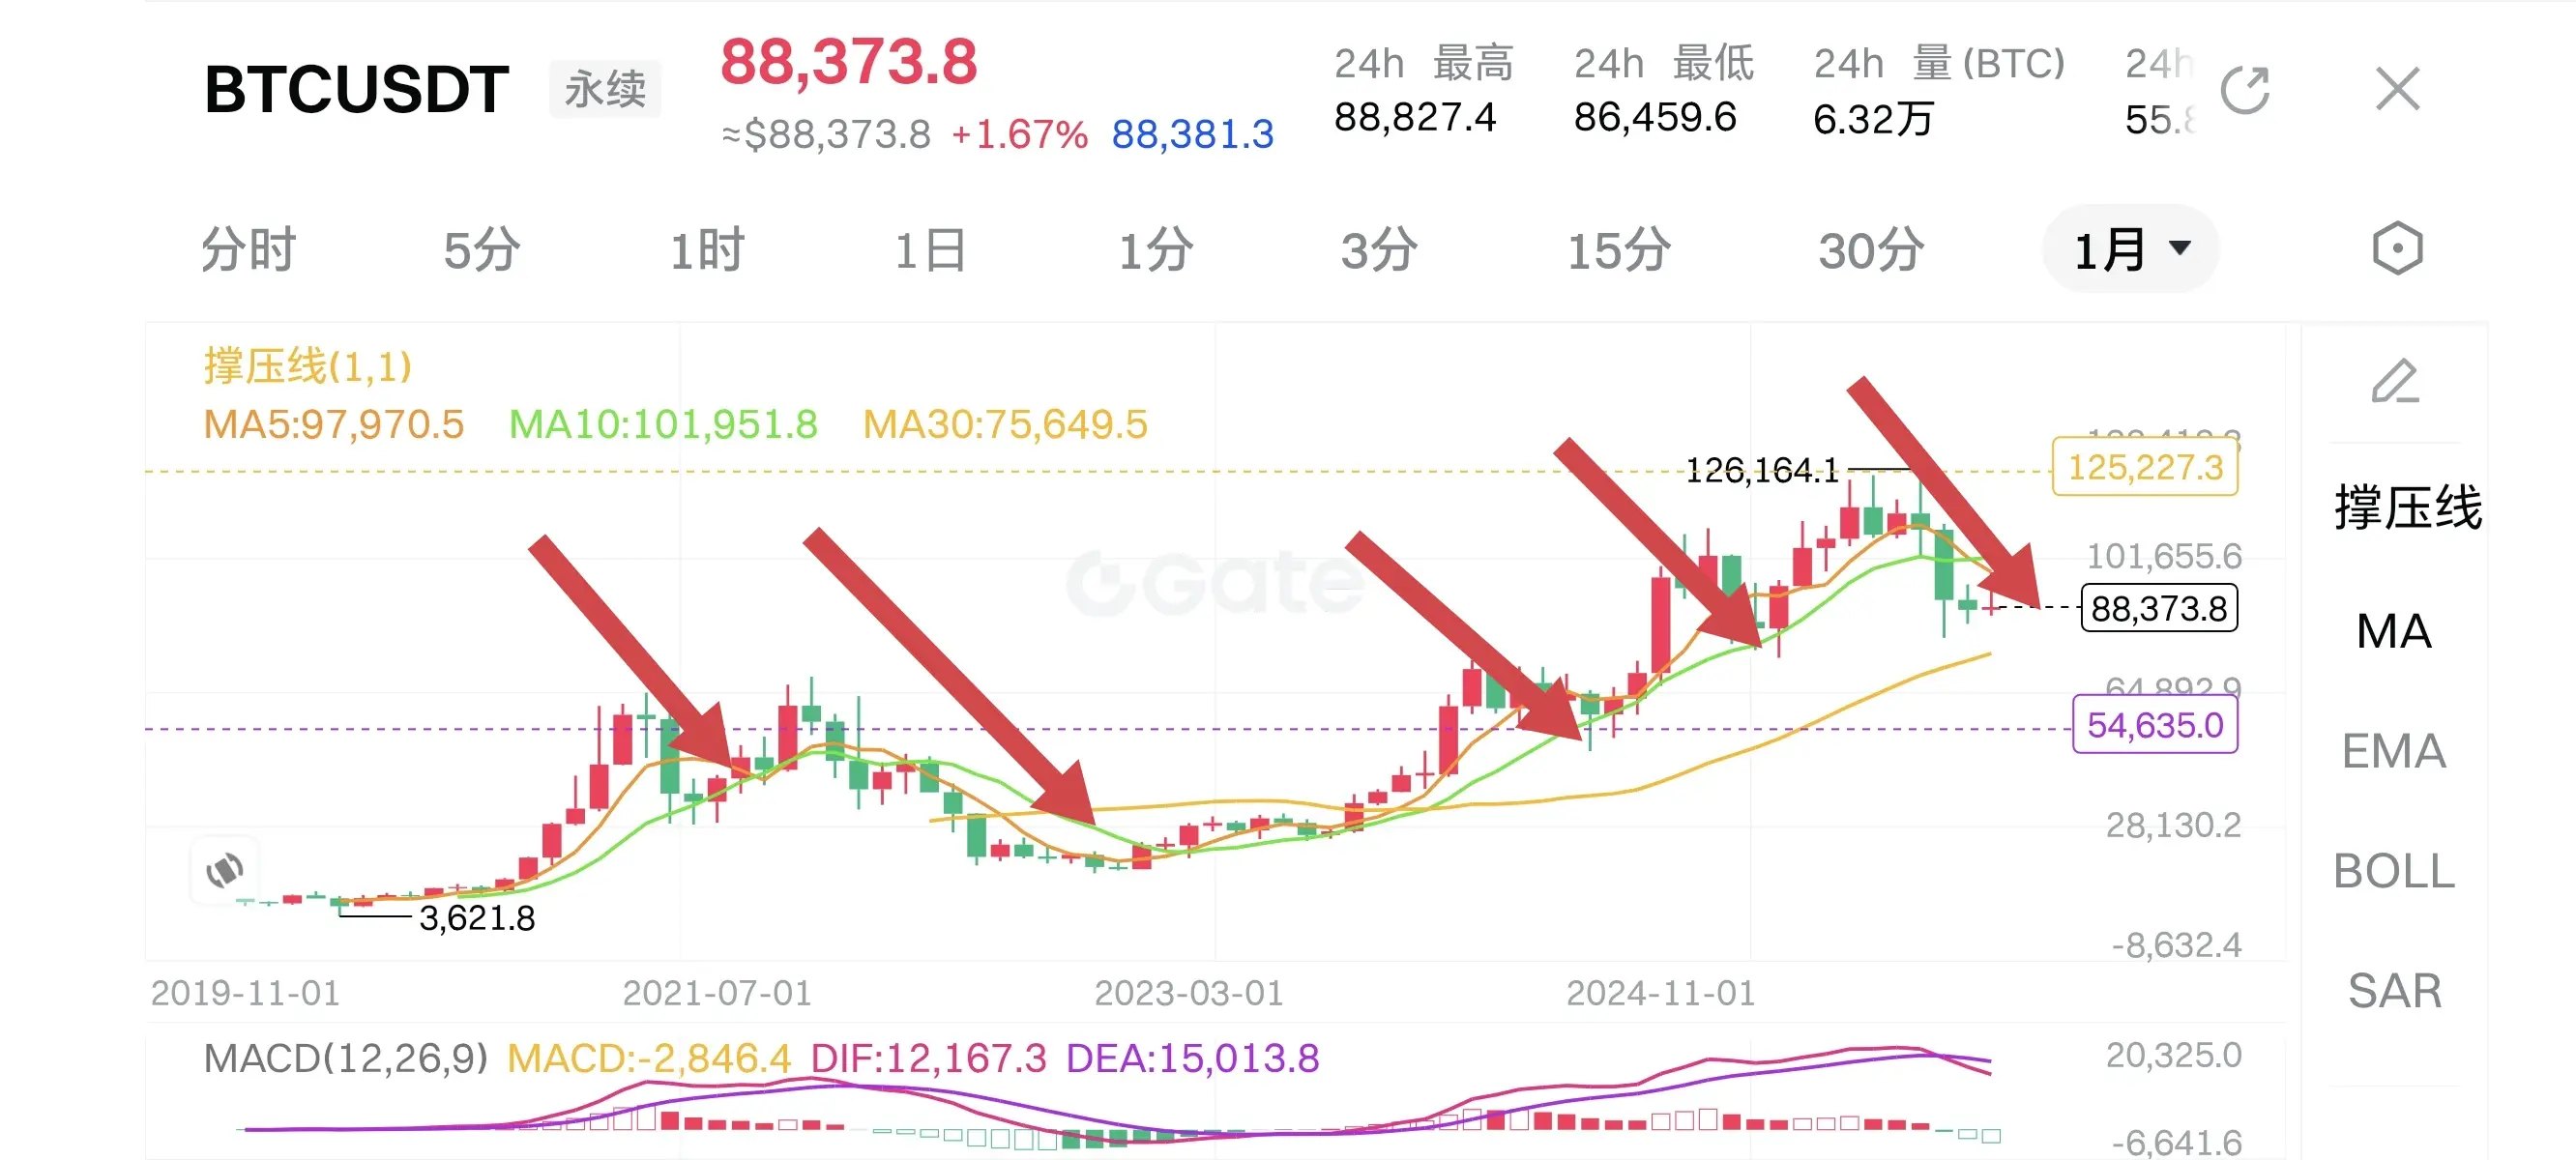
What will be the bottom point of the current BTC bear market?
As of January 27, 2026, BTC's current price is approximately $90,000. The core range and scenarios for the 2026 bear market low are as follows, mainly depending on macro factors, ETF capital flows, and on-chain support strength.
1. Core Range (probability from high to low)
- Baseline (60%-70%): $58,000 - $65,000. Corresponds to 75% supply cost support, the breakeven line for miners after halving, combined with moderate ETF outflows, Federal Reserve tightening but not extreme, representing the typical institutional consensus bear mar
BTC2.15%

MC:$3.33KHolders:1
0.00%
- Reward
- like
- Comment
- Repost
- Share
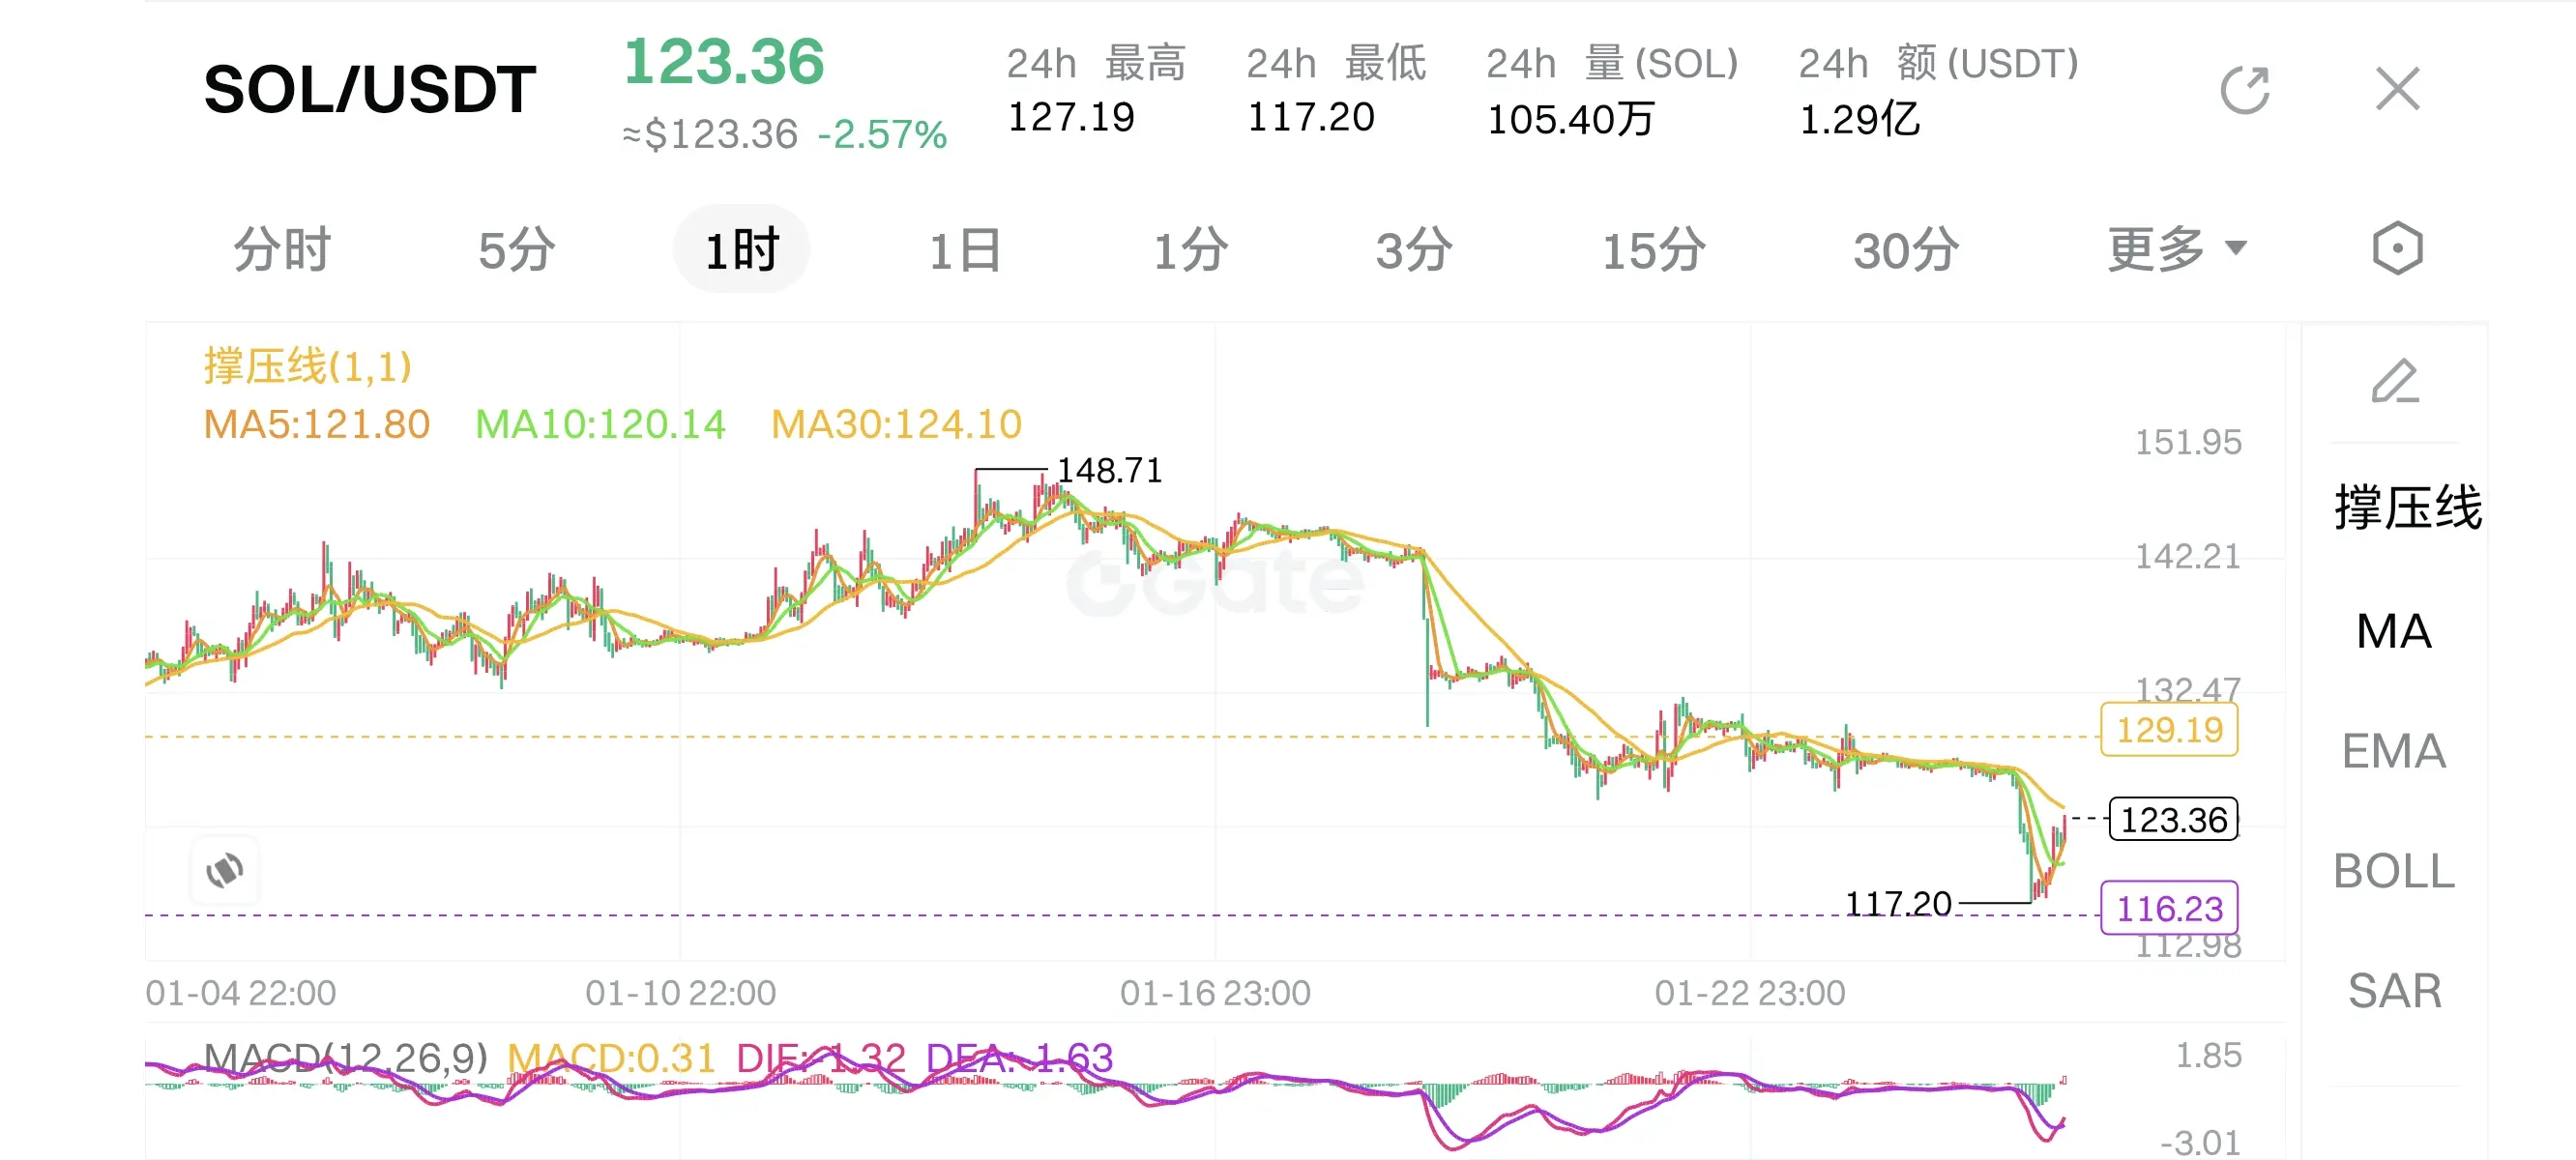
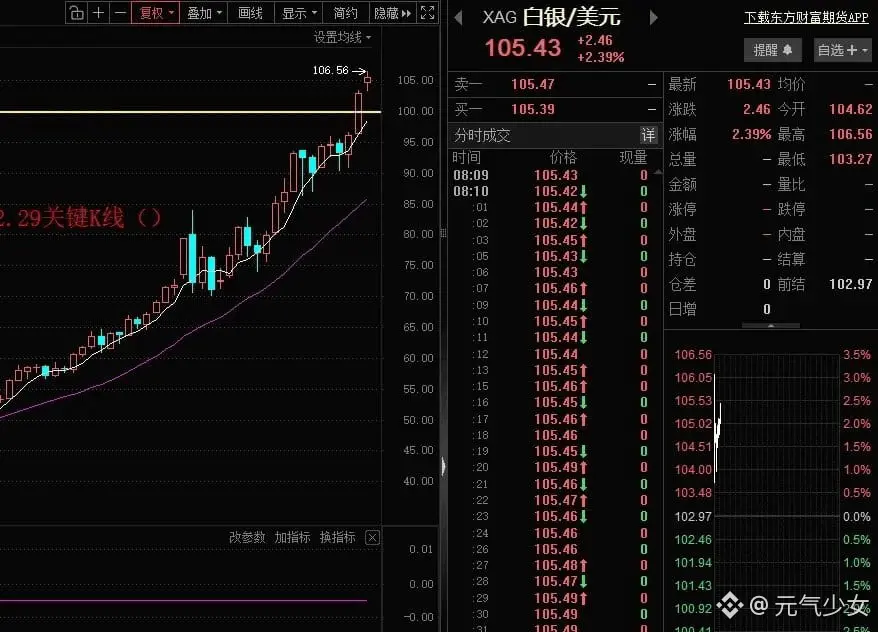
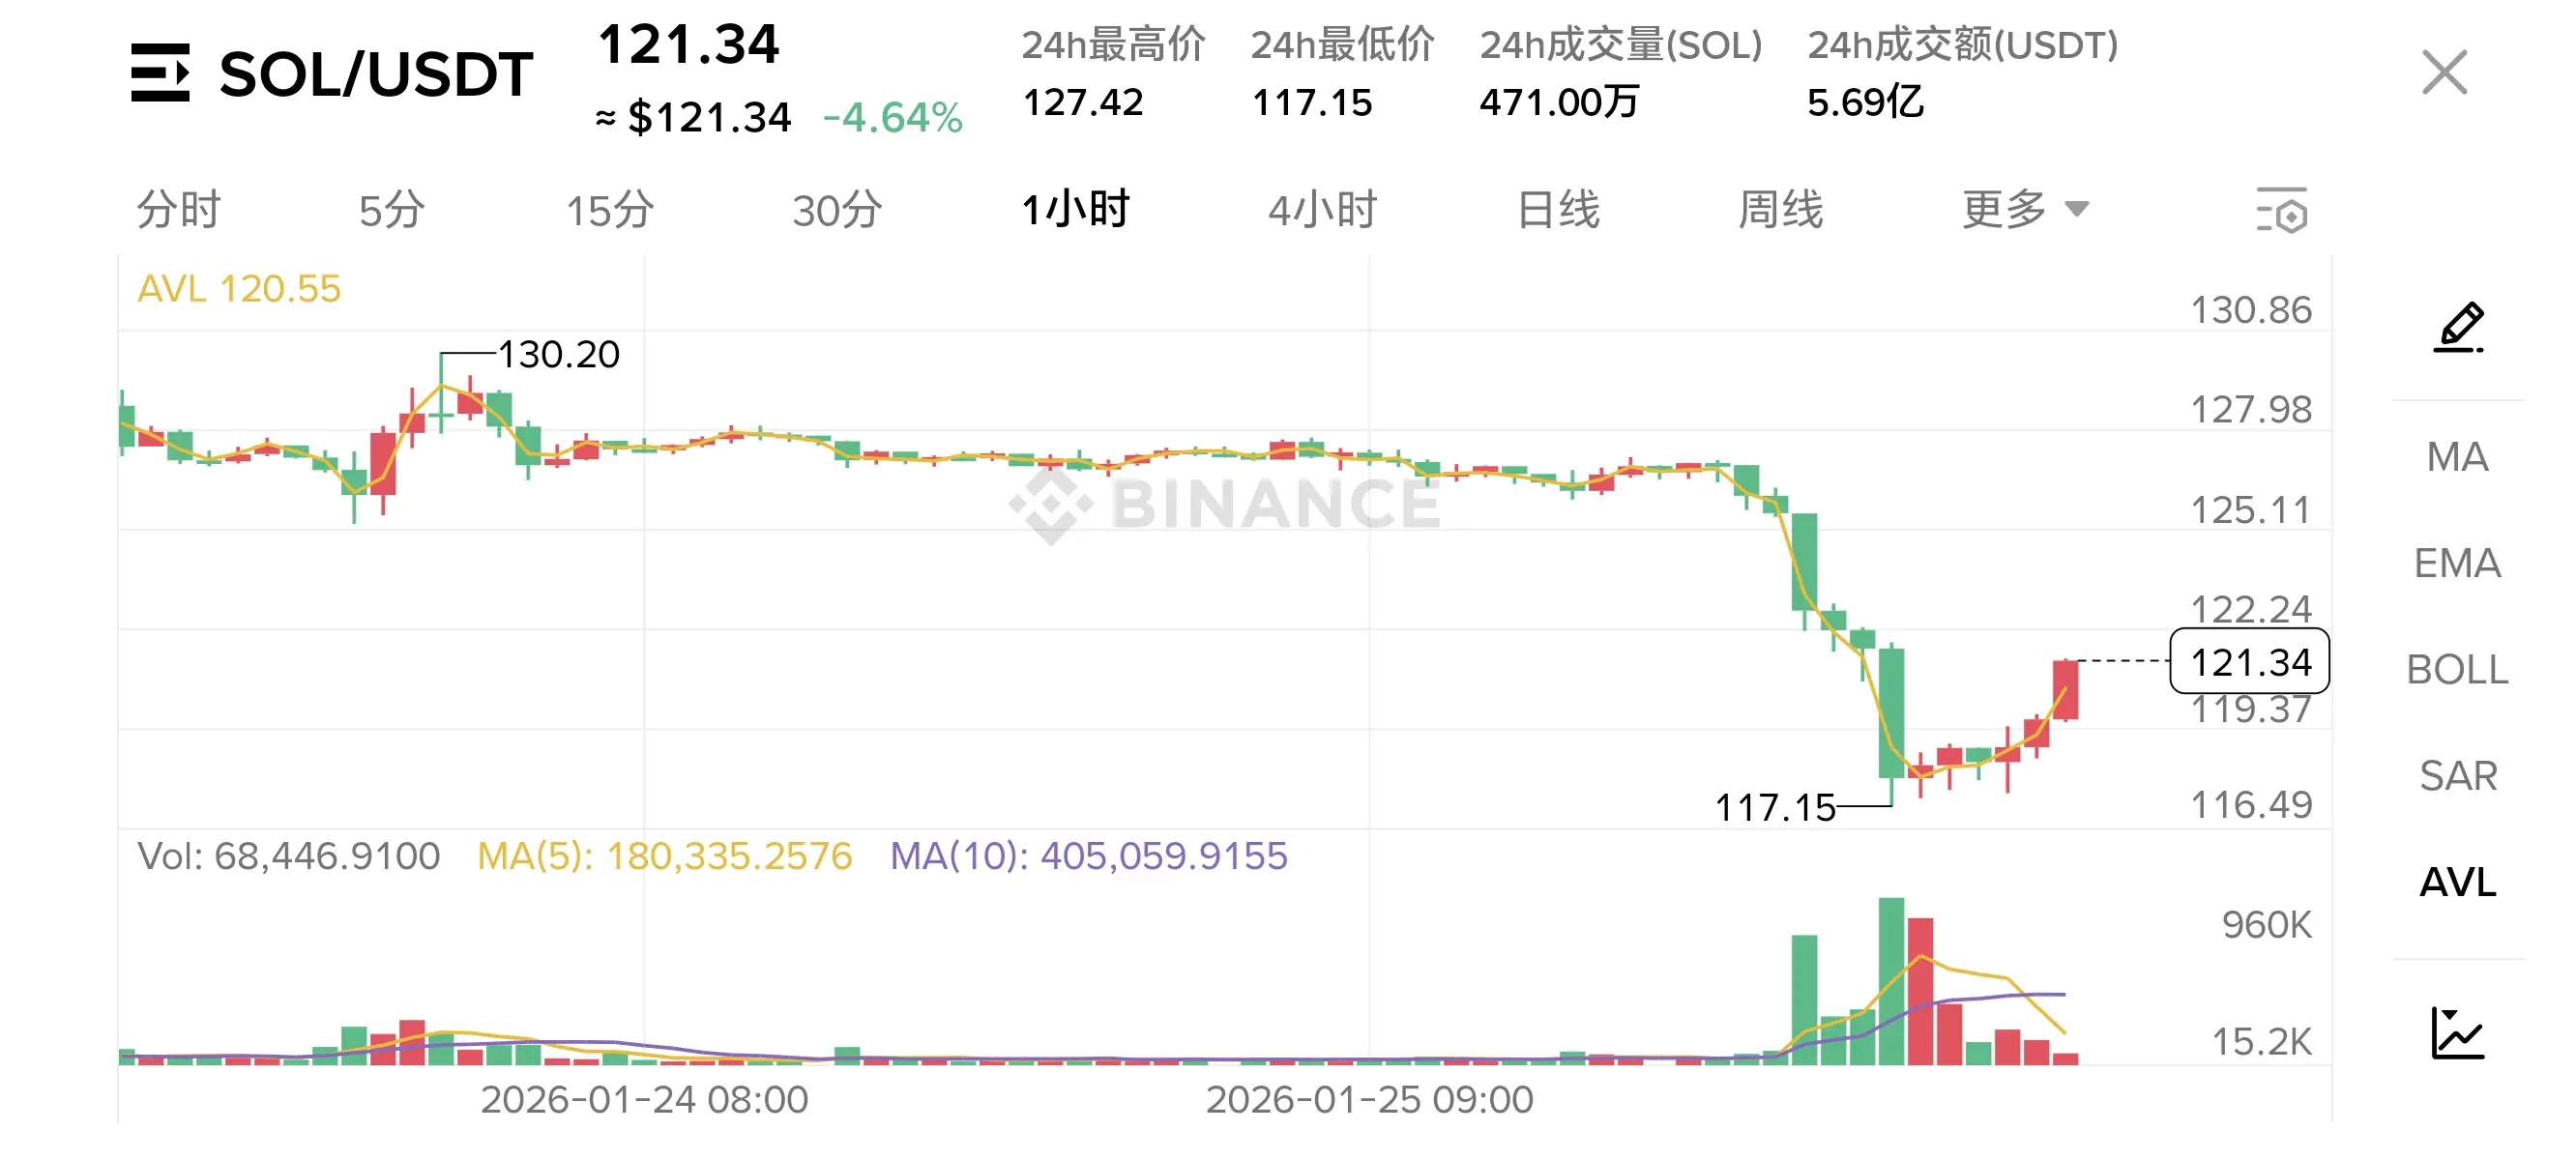
#黄金白银再创新高 Silver and Sol, who can reach $300 first?
Silver XAG is currently at $108, needing an increase of about 177.8% to reach $300; $SOL is currently at $121, needing an increase of about 147.9% to reach $300.
I am more optimistic about Sol, what about you? Leave your answer in the comments, let's discuss and witness together! $SOL
Silver XAG is currently at $108, needing an increase of about 177.8% to reach $300; $SOL is currently at $121, needing an increase of about 147.9% to reach $300.
I am more optimistic about Sol, what about you? Leave your answer in the comments, let's discuss and witness together! $SOL
SOL2.22%
MC:$3.45KHolders:2
0.04%
- Reward
- 1
- Comment
- Repost
- Share
Crypto Circle #牛市 #熊市 Core Investment Strategies (Anchored to BTC, Light Altcoins / Heavy Risk Control)
Core Principles: Profit from trends in a bull market, profit from chips in a bear market, avoid full leverage and chasing highs in both markets. Strategies are completely opposite, tailored to different market rhythms and core needs.
Bull Market Investment Strategy: Follow the trend, lock in profits, avoid bubbles
Core Goal: Capture trend profits, prioritize taking profits, avoid the top, and hedge against late-stage bubble risks
1. Position and Assets: Lightly diversified positions (no mor
View OriginalCore Principles: Profit from trends in a bull market, profit from chips in a bear market, avoid full leverage and chasing highs in both markets. Strategies are completely opposite, tailored to different market rhythms and core needs.
Bull Market Investment Strategy: Follow the trend, lock in profits, avoid bubbles
Core Goal: Capture trend profits, prioritize taking profits, avoid the top, and hedge against late-stage bubble risks
1. Position and Assets: Lightly diversified positions (no mor

MC:$3.45KHolders:2
0.04%
- Reward
- 2
- Comment
- Repost
- Share
$BTC $ETH $XRP SOL has been oscillating within a wide range on the 12-hour chart. Today, pay attention to the 139.07 level. If the 4-hour chart rebounds and stays above this level, the market will continue to rally. Resistance levels to watch are: 141.48-144.52-147.64.
If the 4-hour chart cannot break above 139.07, then this small rebound lacks strength. Support levels to watch are: 135.99-133.30-130.13.
XRP: The 1-2-4 hour charts are bearish. Pay attention to the 2.3095 level. If the 4-hour chart stays above this level, it will rebound. Resistance levels to watch are: 2.3725-2.4368-2.4976.
I
View OriginalIf the 4-hour chart cannot break above 139.07, then this small rebound lacks strength. Support levels to watch are: 135.99-133.30-130.13.
XRP: The 1-2-4 hour charts are bearish. Pay attention to the 2.3095 level. If the 4-hour chart stays above this level, it will rebound. Resistance levels to watch are: 2.3725-2.4368-2.4976.
I
MC:$3.45KHolders:2
0.04%
- Reward
- 1
- Comment
- Repost
- Share
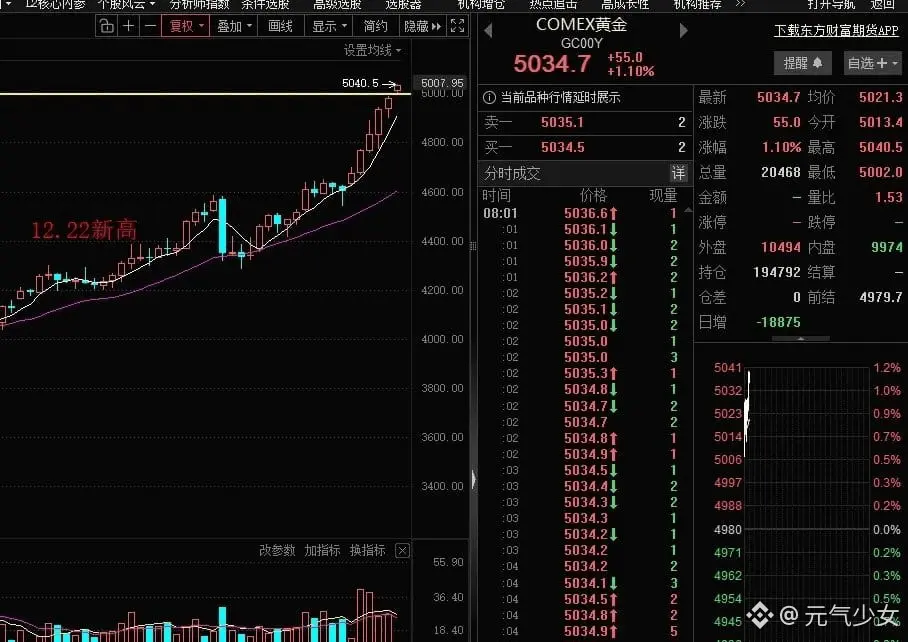
What is the truth behind #黄金白银再创新高 ?
Gold and silver reaching new highs is the result of long-term, medium-term, and short-term factors resonating. Silver is additionally driven by industrial demand. The core logic is as follows:
1. Long-term core (Gold price "floor")
- Central bank gold purchases: China's central bank has increased holdings for 14 consecutive months. Global central banks are de-dollarizing and diversifying reserves, continuously buying to solidify the bottom.
- Weakening dollar credibility: U.S. debt exceeds $38.5 trillion, with high debt interest pressures; the Federal Reser
View OriginalGold and silver reaching new highs is the result of long-term, medium-term, and short-term factors resonating. Silver is additionally driven by industrial demand. The core logic is as follows:
1. Long-term core (Gold price "floor")
- Central bank gold purchases: China's central bank has increased holdings for 14 consecutive months. Global central banks are de-dollarizing and diversifying reserves, continuously buying to solidify the bottom.
- Weakening dollar credibility: U.S. debt exceeds $38.5 trillion, with high debt interest pressures; the Federal Reser

MC:$3.45KHolders:2
0.04%
- Reward
- 1
- Comment
- Repost
- Share