2026 GTAI Price Prediction: Expert Analysis and Market Forecast for the Next Generation AI Token

Introduction: GTAI's Market Position and Investment Value
GT-Protocol (GTAI), as a pioneering Web3 AI execution technology platform focused on AI-portfolio management and trading across CeFi, DeFi, and NFT markets, has been developing its ecosystem since its launch in 2024. As of 2026, GTAI has a market capitalization of approximately $1.18 million, with a circulating supply of about 40.58 million tokens, and the price is currently around $0.029. This asset, known for its "AI-powered conversational investment interface," is playing an increasingly important role in democratizing sophisticated investment strategies for both Web3 and Web2 users.
This article will comprehensively analyze GTAI's price trajectory from 2026 to 2031, combining historical patterns, market supply and demand dynamics, ecosystem development, and macroeconomic conditions to provide investors with professional price forecasts and practical investment strategies.
I. GTAI Price History Review and Current Market Status
GTAI Historical Price Evolution Trajectory
- 2024: Token launched on Gate.com in January with an initial offering price of $0.2, reaching a peak of $5.4994 in March 2024
- 2024-2025: Market correction phase, experiencing significant downward pressure from the March peak
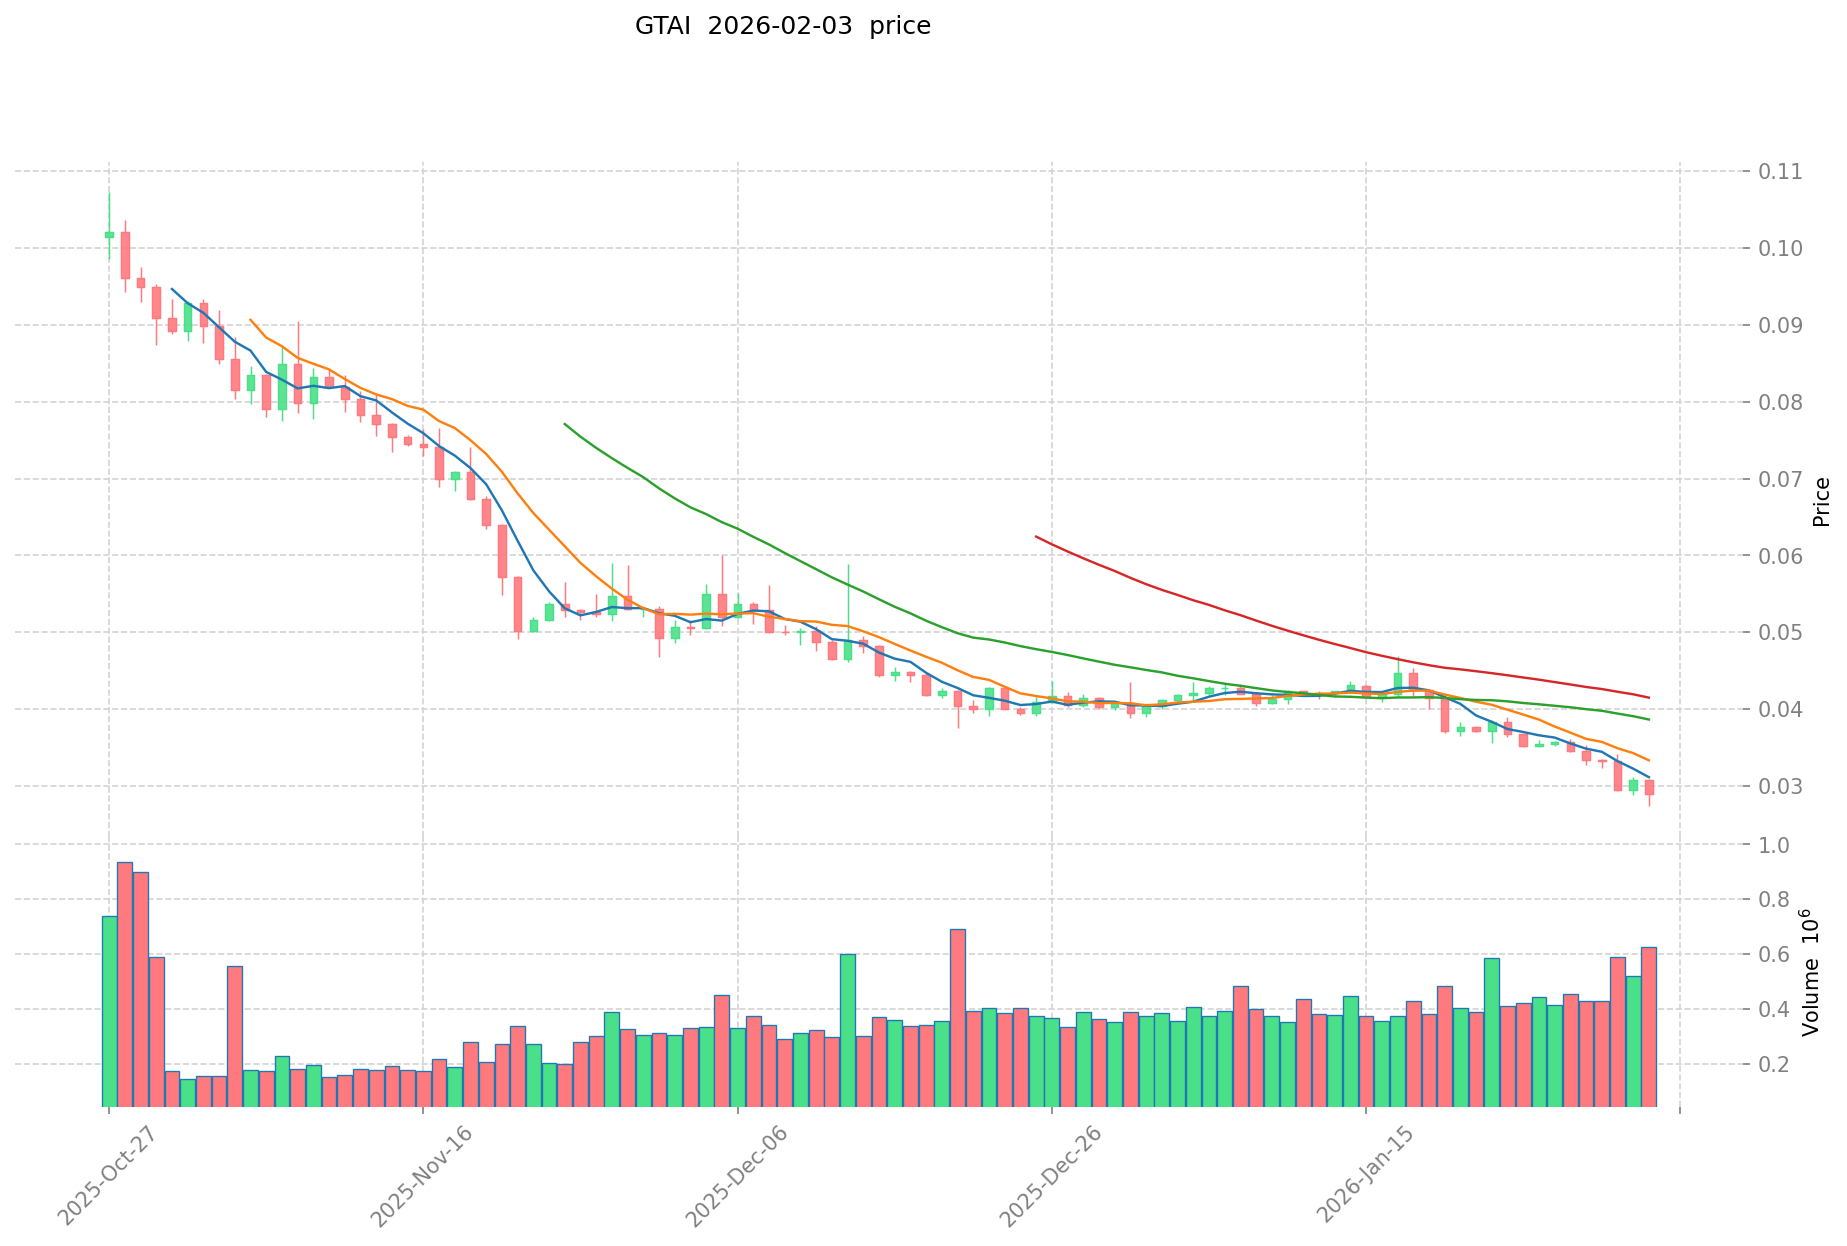
- 2026: Price declined to a recorded low of $0.02736 on February 2, 2026, representing a substantial correction from previous levels
GTAI Current Market Situation
As of February 3, 2026, GTAI is trading at $0.02899, showing a slight recovery from its recent low point. The token has experienced a 0.21% decrease over the past hour and a 5.51% decline in the last 24 hours. Over broader timeframes, GTAI has seen an 18.29% decrease over 7 days and a 30.7% decline over 30 days. The past year has seen a 91.34% correction from higher price levels.
The current 24-hour trading volume stands at $18,440.90, while the 24-hour price range has fluctuated between $0.02736 and $0.03087. GTAI maintains a market capitalization of approximately $1.18 million, with a circulating supply of 40,576,979 tokens out of a maximum supply of 75,000,000 tokens, representing a circulation rate of 54.1%. The fully diluted market capitalization is calculated at $2.17 million.
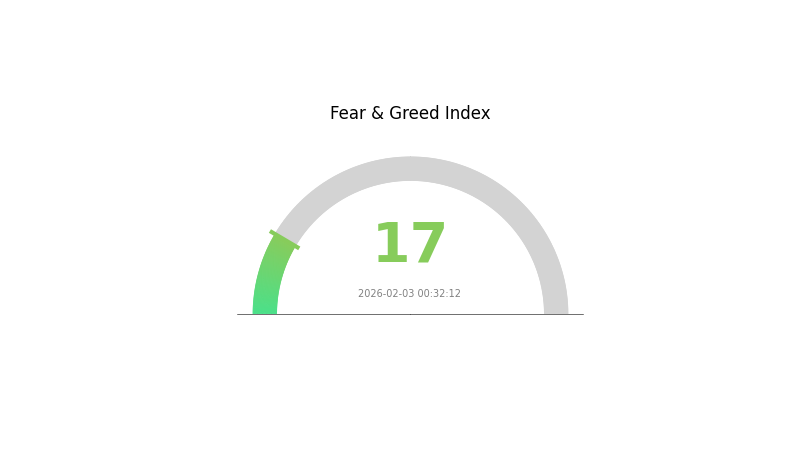
GT-Protocol currently ranks #2410 in the cryptocurrency market, with a market dominance of 0.000078%. The token is listed on 8 exchanges and has attracted 18,487 holders. According to current market sentiment indicators, the fear and greed index shows a reading of 17, indicating an extreme fear sentiment in the broader market environment.
Click to view current GTAI market price
GTAI Market Sentiment Indicator
2026-02-03 Fear and Greed Index: 17 (Extreme Fear)
Click to view the current Fear & Greed Index
The cryptocurrency market is currently experiencing extreme fear, with the Fear and Greed Index plummeting to 17. This exceptional reading signals heightened market anxiety and pessimism among investors. When the index reaches such lows, it often reflects panic selling and negative sentiment dominating the market. Historically, extreme fear can present contrarian opportunities for long-term investors, as markets tend to recover from panic-driven lows. However, caution remains essential during periods of high volatility and uncertainty. Monitor market developments closely before making investment decisions.
GTAI Holdings Distribution
According to the latest on-chain data, the top 5 addresses collectively hold approximately 38.49% of the total GTAI supply, with the remaining 61.51% distributed among other addresses. The largest holder controls 9.34% of the total supply, while the second through fifth positions range from 6.65% to 8.00%. This distribution pattern indicates a relatively moderate concentration level in GTAI's address structure, neither exhibiting extreme centralization nor complete decentralization.
From a market structure perspective, this distribution presents both opportunities and risks. The moderate concentration suggests that major holders possess certain influence over price movements, particularly during low-liquidity periods where coordinated selling could trigger significant volatility. However, the fact that no single address controls more than 10% of supply, combined with the majority (61.51%) being dispersed among numerous smaller holders, provides a reasonable buffer against manipulation by any individual entity. This balance generally supports organic price discovery mechanisms while maintaining adequate liquidity depth for normal trading activities.
The current holdings distribution reflects a relatively healthy on-chain ecosystem with acceptable decentralization characteristics. The presence of multiple substantial holders rather than a single dominant entity reduces systemic risk and enhances market resilience. Nevertheless, investors should monitor any significant shifts in this distribution pattern, as concentrated accumulation or distribution by top addresses could signal important changes in market sentiment or strategic positioning among major stakeholders.
Click to view current GTAI Holdings Distribution
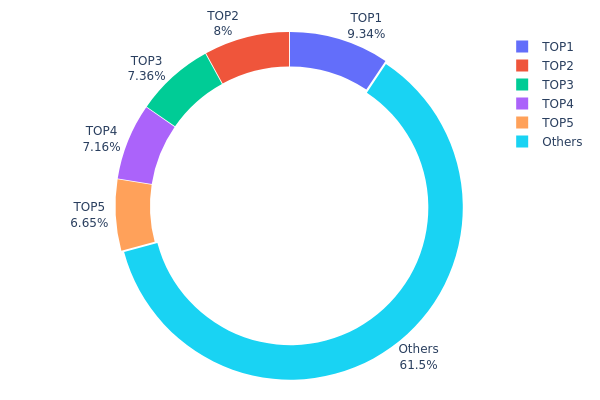
| Top | Address | Holding Qty | Holding (%) |
|---|---|---|---|
| 1 | 0xf89d...5eaa40 | 7007.71K | 9.34% |
| 2 | 0xbbbf...7cf4e4 | 6000.66K | 8.00% |
| 3 | 0xd4c0...d9284a | 5518.46K | 7.35% |
| 4 | 0x4881...64d188 | 5368.86K | 7.15% |
| 5 | 0x02c0...2dfbad | 4991.07K | 6.65% |
| - | Others | 46113.25K | 61.51% |
II. Core Factors Influencing GTAI's Future Price
Supply Mechanism
- Adoption-Driven Supply Dynamics: GTAI token value is influenced by its adoption rate, with increasing integration into AI and blockchain infrastructure affecting supply-demand balance.
- Historical Patterns: GTAI reached a notable peak on March 10, 2024, potentially driven by market enthusiasm for AI-powered Web3 solutions. The token experienced a low point on November 22, 2025, possibly reflecting broader market weakness in the AI crypto sector.
- Current Impact: Market activity and global news continue to drive frequent price fluctuations, with supply-demand relationships creating volatility, particularly during high-volatility periods.
Institutional and Whale Dynamics
- Platform Integration: GTAI's value is affected by its integration with new platforms and continuous updates to AI and blockchain infrastructure, which may attract institutional interest in the AI-native workspace sector.
Macroeconomic Environment
- Global News Sensitivity: GTAI demonstrates high sensitivity to global news events, with prices potentially fluctuating every few seconds during periods of heightened market activity.
- Market Demand Correlation: The token's performance is closely tied to overall market demand for AI-driven solutions and blockchain technology applications.
Technology Development and Ecosystem Building
- AI Technology Advancement: As investors increasingly analyze historical performance charts to predict future trends, the development of AI technology and its integration into the blockchain ecosystem plays a key role in GTAI's valuation.
- Infrastructure Updates: Continuous improvements to AI and blockchain infrastructure directly impact GTAI's utility and market positioning, potentially driving long-term value appreciation.
III. 2026-2031 GTAI Price Prediction
2026 Outlook
- Conservative Prediction: $0.02778 - $0.02894
- Neutral Prediction: Around $0.02894
- Optimistic Prediction: Up to $0.0356 (requires favorable market conditions and increased adoption)
2027-2029 Outlook
- Market Stage Expectation: GTAI may enter a gradual growth phase with increasing market recognition and potential ecosystem expansion
- Price Range Predictions:
- 2027: $0.03065 - $0.03808 (approximately 11% growth)
- 2028: $0.0299 - $0.04924 (approximately 21% growth)
- 2029: $0.02701 - $0.0612 (approximately 45% growth potential)
- Key Catalysts: Technology development progress, expansion of AI-related applications, and broader market acceptance of AI tokens
2030-2031 Long-term Outlook
- Baseline Scenario: $0.02999 - $0.0517 (assuming steady ecosystem development and moderate market growth)
- Optimistic Scenario: $0.05170 - $0.06877 (assuming significant technological breakthroughs and mainstream adoption)
- Transformative Scenario: $0.06023 - $0.08132 by 2031 (requires exceptional market conditions, widespread AI integration, and substantial increase in trading volume)
- February 3, 2026: GTAI trading within the predicted range of $0.02778 - $0.0356 (early-stage development phase)
| Year | Predicted High Price | Predicted Average Price | Predicted Low Price | Price Change |
|---|---|---|---|---|
| 2026 | 0.0356 | 0.02894 | 0.02778 | 0 |
| 2027 | 0.03808 | 0.03227 | 0.03065 | 11 |
| 2028 | 0.04924 | 0.03517 | 0.0299 | 21 |
| 2029 | 0.0612 | 0.04221 | 0.02701 | 45 |
| 2030 | 0.06877 | 0.0517 | 0.02999 | 78 |
| 2031 | 0.08132 | 0.06023 | 0.03253 | 107 |
IV. GTAI Professional Investment Strategies and Risk Management
GTAI Investment Methodology
(1) Long-Term Holding Strategy
- Target Investors: Investors who believe in the long-term potential of AI-driven Web3 infrastructure and portfolio management solutions
- Operational Recommendations:
- Consider dollar-cost averaging (DCA) to accumulate GTAI positions gradually, mitigating the impact of short-term price volatility
- Monitor project development progress, partnership announcements, and adoption metrics across CeFi, DeFi, and NFT markets
- Utilize secure storage solutions such as Gate Web3 Wallet for long-term holdings, ensuring proper backup of recovery phrases
(2) Active Trading Strategy
- Technical Analysis Tools:
- Moving Averages: Track 50-day and 200-day moving averages to identify potential trend reversals and momentum shifts
- Volume Analysis: Monitor trading volume patterns on Gate.com to gauge market interest and potential breakout opportunities
- Swing Trading Considerations:
- Establish clear entry and exit points based on support and resistance levels
- Implement stop-loss orders to limit potential downside exposure during volatile market conditions
GTAI Risk Management Framework
(1) Asset Allocation Principles
- Conservative Investors: 1-3% of crypto portfolio allocation
- Moderate Investors: 3-7% of crypto portfolio allocation
- Aggressive Investors: 7-15% of crypto portfolio allocation
(2) Risk Hedging Approaches
- Diversification Strategy: Balance GTAI holdings with exposure to established cryptocurrencies and stablecoins to reduce portfolio volatility
- Position Sizing: Avoid over-concentration in any single asset, maintaining disciplined position limits based on individual risk tolerance
(3) Secure Storage Solutions
- Hot Wallet Recommendation: Gate Web3 Wallet for active trading and convenient access to DeFi protocols
- Cold Storage Approach: Hardware wallets or paper wallets for long-term holdings to minimize online exposure risks
- Security Precautions: Enable two-factor authentication, regularly update wallet software, and never share private keys or seed phrases with anyone
V. GTAI Potential Risks and Challenges
GTAI Market Risks
- High Volatility: GTAI has experienced significant price fluctuations, with a 1-year decline of approximately 91.34%, reflecting the inherent volatility in emerging AI and Web3 tokens
- Limited Liquidity: With a 24-hour trading volume of approximately $18,440 and listing on 8 exchanges, GTAI may face liquidity constraints during periods of market stress
- Market Sentiment Dependency: Token performance may be heavily influenced by broader market trends in AI, DeFi, and NFT sectors, creating correlation risks
GTAI Regulatory Risks
- Evolving AI Regulation: Potential regulatory developments concerning AI applications in financial services could impact GT-Protocol's operational framework
- DeFi Compliance Uncertainty: Ongoing regulatory scrutiny of decentralized finance platforms may introduce compliance challenges for protocols operating across CeFi and DeFi markets
- Cross-Border Regulatory Divergence: Different jurisdictions may implement varying approaches to crypto asset regulation, potentially affecting token accessibility and project operations
GTAI Technical Risks
- Smart Contract Vulnerabilities: As with any blockchain-based protocol, potential smart contract bugs or exploits could pose security risks to user funds and protocol integrity
- Integration Complexity: The ambitious goal of seamless integration across Web3 and Web2 platforms presents technical challenges that may affect development timelines
- Competitive Pressure: The AI and Web3 space is rapidly evolving, with numerous projects competing for market share, which could impact GT-Protocol's adoption trajectory
VI. Conclusion and Action Recommendations
GTAI Investment Value Assessment
GT-Protocol represents an innovative approach to AI-driven portfolio management and trading across CeFi, DeFi, and NFT markets. The project's focus on user-friendly AI interfaces and ambitious mission to onboard 100 million users highlights its growth potential. However, the token has experienced substantial price decline over the past year, with current trading near lower price ranges. The circulating supply represents approximately 54% of the total supply, indicating potential future supply dynamics. Investors should weigh the project's technological promise against current market performance and inherent risks in the AI-crypto intersection.
GTAI Investment Recommendations
✅ Beginners: Consider starting with a small allocation (no more than 1-2% of total crypto portfolio) while thoroughly researching the project's fundamentals and monitoring market developments ✅ Experienced Investors: Evaluate GTAI as a speculative position within a diversified portfolio, implementing strict risk management protocols and closely tracking project milestones and partnership announcements ✅ Institutional Investors: Conduct comprehensive due diligence on GT-Protocol's technology stack, team credentials, and market positioning before considering allocation as part of a broader AI-focused crypto investment thesis
GTAI Trading Participation Methods
- Spot Trading on Gate.com: Purchase GTAI directly through Gate.com's spot trading platform, offering immediate ownership and flexibility
- Dollar-Cost Averaging: Establish a systematic investment plan to accumulate GTAI positions over time, reducing timing risk exposure
- Portfolio Integration: Incorporate GTAI as part of a thematic investment strategy focused on AI and Web3 infrastructure development
Cryptocurrency investment carries extreme risks, and this article does not constitute investment advice. Investors should make prudent decisions based on their own risk tolerance and are advised to consult professional financial advisors. Never invest more than you can afford to lose.
FAQ
What is GTAI token and what is its use case?
GTAI token enables holders to participate in GT DAO governance votes, influencing the GT ecosystem's strategy and development direction. It grants voting power within the decentralized autonomous organization.
What factors influence GTAI price movements?
GTAI price movements are driven by supply and demand dynamics, overall cryptocurrency market conditions, technological developments, trading volume, and investor sentiment toward the protocol.
What is the historical price trend of GTAI?
GTAI's price was $0.02968 in 2026, with a 6.60% increase over the past 24 hours. Historical trends show volatility driven by market demand and sentiment fluctuations.
How can I predict or analyze GTAI price in the short term?
Short-term GTAI price analysis relies on technical indicators, trading volume trends, and market sentiment. Monitor daily price movements, support/resistance levels, and on-chain data. Use chart analysis and real-time market conditions to identify potential price ranges over the next 30 days.
What is the market cap and trading volume of GTAI?
As of February 2026, GTAI has a market cap of $1.74 million and a 24-hour trading volume of $16.71K, with the token trading at approximately $0.043.
How does GTAI compare to other AI-related tokens?
GTAI has outperformed all other AI tokens on BNB Chain, rallying 150% in 30 days. It broke $1 in October and maintains top performer status in the AI sector, demonstrating strong market demand for AI-focused cryptocurrencies.
What are the risks associated with GTAI price volatility?
GTAI price volatility carries risks of significant market fluctuations, potential price manipulation, and regulatory uncertainties across different jurisdictions. Rapid price swings may impact trading positions and investment value.
Where can I buy and sell GTAI tokens?
You can buy and sell GTAI tokens on multiple crypto exchanges including MEXC Global, Gate.com, and Kucoin. These platforms offer strong trading volume and liquidity for GT Protocol tokens.
What is the supply and tokenomics of GTAI?
GTAI has a total supply of 75 million tokens with 7.7 million currently in circulation. As the native token of GT Protocol, it features a deflationary mechanism designed to reward long-term holders and ensure sustainable ecosystem growth.
Share
Content
Introduction: GTAI's Market Position and Investment Value
I. GTAI Price History Review and Current Market Status
II. Core Factors Influencing GTAI's Future Price
III. 2026-2031 GTAI Price Prediction
IV. GTAI Professional Investment Strategies and Risk Management
V. GTAI Potential Risks and Challenges
VI. Conclusion and Action Recommendations
FAQ
How to Buy Cryptocurrency


Trending Cryptocurrencies


What will be the market capitalization of USDC in 2025? Analysis of the stablecoin market landscape.

How is DeFi different from Bitcoin?

What is DeFi: Understanding Decentralized Finance in 2025
USDC stablecoin 2025 Latest Analysis: Principles, Advantages, and Web3 Eco-Applications
Development of Decentralized Finance Ecosystem in 2025: Integration of Decentralized Finance Applications with Web3

2025 USDT USD Complete Guide: A Must-Read for Newbie Investors
How to Buy Bitcoin Anonymously

Top 10 Play-to-Earn NFT Games
2026 NBLU Price Prediction: Expert Analysis and Market Forecast for NewBlue Interactive Stock Performance
2026 KYO Price Prediction: Expert Analysis and Market Forecast for the Upcoming Bull Run

2026 MTRG Price Prediction: Expert Analysis and Market Forecast for Matrixport Token