2026 MAN Price Prediction: Expert Analysis and Market Forecast for the Decentralized Finance Token

Introduction: MAN's Market Position and Investment Value
MatrixAI (MAN), positioned as a pioneering public blockchain that deeply integrates artificial intelligence technology with blockchain infrastructure, has been developing since its launch in 2018. As of 2026, MAN maintains a market capitalization of approximately $1.16 million, with a circulating supply of around 472.41 million tokens, and the price stabilizes at roughly $0.002462. This asset, recognized as an advocate and leader in the global AI + blockchain field, is playing an increasingly important role in building self-optimizing blockchain networks that address efficiency, speed, security, usability, and flexibility challenges.
This article will comprehensively analyze MAN's price trends from 2026 to 2031, combining historical patterns, market supply and demand dynamics, ecosystem development, and macroeconomic environments to provide investors with professional price forecasts and practical investment strategies.
I. MAN Price History Review and Current Market Status
MAN Historical Price Evolution Trajectory
- 2018: MAN reached its historical price peak on May 4, 2018, trading at $2.08
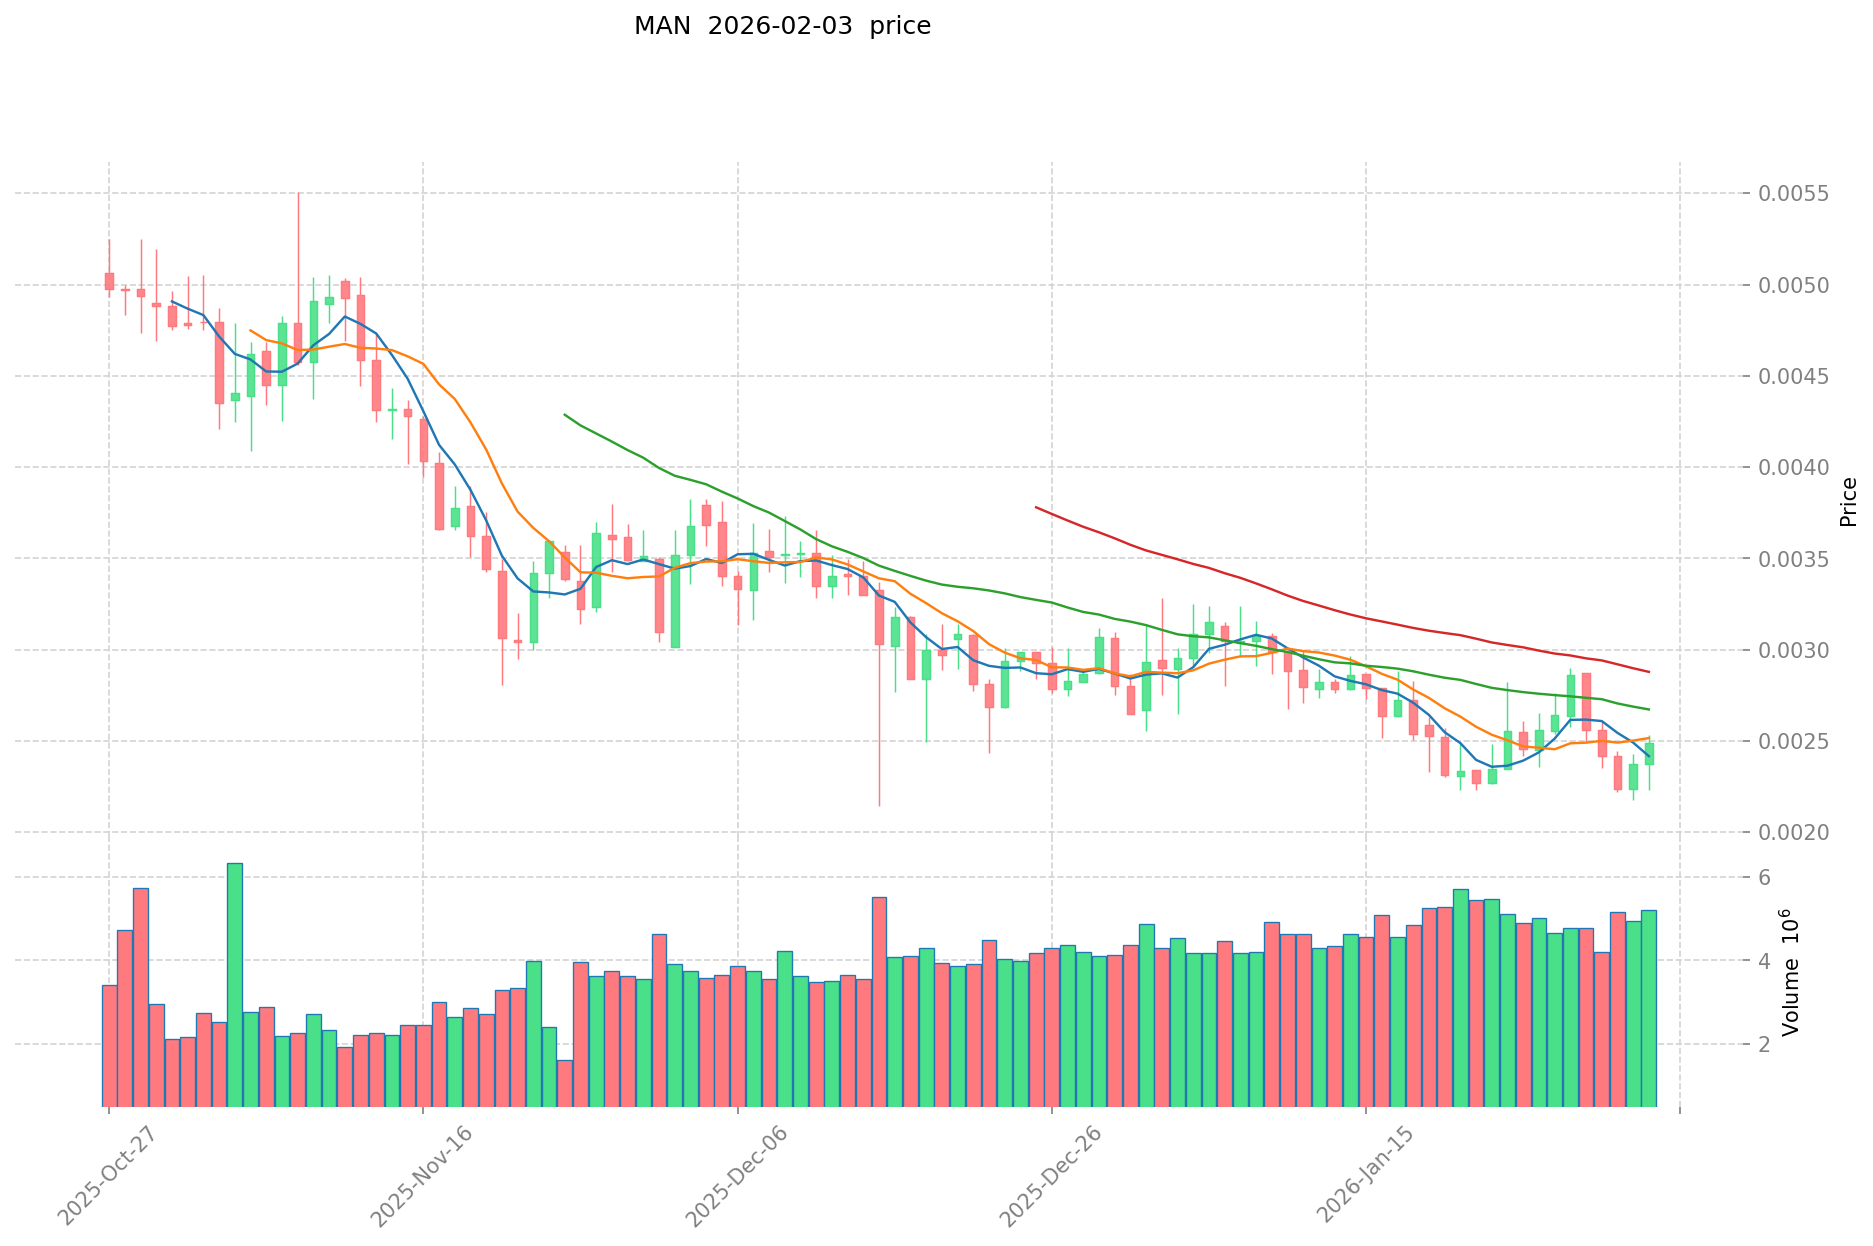
- 2026: On February 1, 2026, MAN recorded its historical low price at $0.00220939
- Past Year: The token experienced a significant decline, with prices falling by 74.27% over the 12-month period
MAN Current Market Dynamics
As of February 3, 2026, MAN is trading at $0.002462, showing a recent upward movement with a 3.87% increase over the past 24 hours and a 3.62% gain in the last hour. The 24-hour trading range fluctuated between a low of $0.002232 and a high of $0.002535, with total trading volume reaching $12,086.04.
The token's circulating supply stands at 472,411,053.63 MAN, representing 47.24% of the total supply of 772,409,998.77 MAN, with a maximum supply capped at 1 billion tokens. The current market capitalization is approximately $1.16 million, while the fully diluted valuation sits at around $1.90 million. MAN holds a market dominance of 0.000068% in the cryptocurrency sector.
Over the past week, MAN has declined by 3.64%, and the 30-day performance shows a decrease of 16.6%. The token is listed on one exchange, with a holder base of 22,707 addresses. The current market sentiment indicator reflects a score of 17, indicating extreme fear conditions in the broader cryptocurrency market.
Click to view current MAN market price
MAN Market Sentiment Index
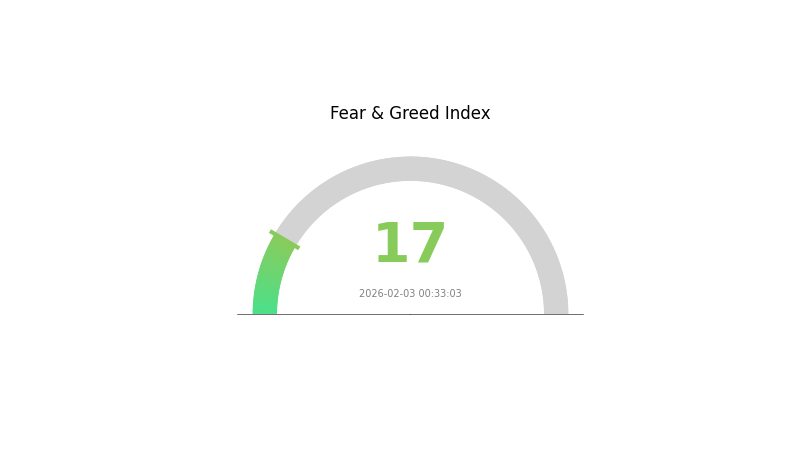
2026-02-03 Fear and Greed Index: 17(Extreme Fear)
Click to view the current Fear & Greed Index
The cryptocurrency market is currently experiencing extreme fear, with the Fear and Greed Index at 17. This indicates significant market pessimism and risk aversion among investors. When the index reaches such low levels, it typically signals capitulation and panic selling. This environment may present contrarian opportunities for long-term investors, as extreme fear often precedes market reversals. However, caution is advised, as further downside cannot be ruled out. Monitor key support levels and market sentiment indicators closely for potential turning points.
MAN Token Holdings Distribution
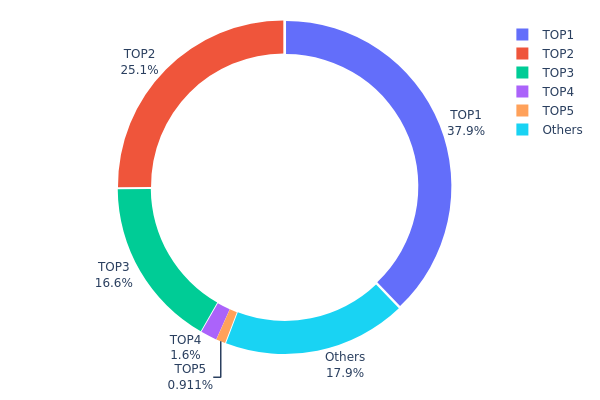
The holdings distribution chart reveals the concentration of token ownership across different wallet addresses, serving as a key indicator of decentralization and potential market manipulation risks. According to the latest on-chain data, MAN demonstrates a highly centralized distribution pattern. The top three addresses collectively control 79.57% of the total token supply, with the largest holder alone possessing 94,716.09K tokens (37.88%), followed by the second and third addresses holding 25.12% and 16.57% respectively. This concentration level significantly exceeds the healthy threshold typically observed in mature cryptocurrency projects.
Such extreme centralization presents notable implications for market dynamics and price stability. When a small number of addresses control the vast majority of circulating supply, it creates substantial vulnerability to coordinated selling pressure and price manipulation. The top holder's ability to influence nearly 40% of supply presents systemic risk, as any large-scale liquidation could trigger cascading market effects. Additionally, the relatively small proportion held by other addresses (17.93%) suggests limited retail participation and weak organic distribution, which may constrain liquidity depth and amplify volatility during trading activities.
From a structural perspective, this distribution pattern indicates MAN remains in an early developmental phase with insufficient decentralization maturity. The concentrated ownership structure raises concerns about governance centralization and potential single-point failure risks within the ecosystem. While such concentration is not uncommon for projects in initial stages or those undergoing strategic token allocation, sustained improvement in distribution breadth will be essential for long-term ecosystem health and investor confidence.
Click to view the current MAN Holdings Distribution
| Top | Address | Holding Qty | Holding (%) |
|---|---|---|---|
| 1 | 0xa27d...0e4af3 | 94716.09K | 37.88% |
| 2 | 0x0d07...b492fe | 62816.24K | 25.12% |
| 3 | 0x93ed...2c7370 | 41442.39K | 16.57% |
| 4 | 0x1870...dda12e | 3992.78K | 1.59% |
| 5 | 0xcf42...c1d650 | 2277.55K | 0.91% |
| - | Others | 44748.46K | 17.93% |
II. Core Factors Influencing MAN's Future Price
Supply Mechanism
- Central Bank Gold Purchases: Global central banks and government institutions continued to increase their gold holdings in 2025, with total purchases reaching 863 tons. This sustained buying behavior represents a core driver supporting gold demand and reflects strategic efforts to optimize foreign exchange reserve structures and hedge against geopolitical risks.
- Historical Pattern: Since 2022, the multipolarization of international reserve asset systems has accelerated, with gold's share in global reserves increasing by 11.9 percentage points compared to end-2021. Gold has surpassed the euro to become the second-largest international reserve asset after the US dollar.
- Current Impact: The continued strategic allocation by central banks is expected to provide sustained support for prices, as official sector demand remains significantly above long-term average levels.
Institutional and Major Holder Dynamics
- Institutional Holdings: Global gold ETF net inflows reached 801 tons in 2025, ranking as the second-highest annual increase in history. Chinese market gold ETF inflows entered the global top three, trailing only the United States and the United Kingdom, with assets under management surging by 243% to reach 248 tons.
- Corporate Adoption: Physical gold investment demand demonstrated robust performance, with global gold bar and coin demand reaching 1,374 tons in 2025, valued at approximately $154 billion, marking a 12-year high.
- National Policy: Multiple countries have accelerated gold reserve accumulation as part of broader de-dollarization trends and efforts to enhance reserve asset security following geopolitical tensions.
Macroeconomic Environment
- Monetary Policy Impact: Market expectations for Federal Reserve rate cuts and a weakening US dollar are supporting gold's investment appeal. The uncertainty surrounding monetary policy decisions and potential dovish shifts continue to drive safe-haven demand.
- Inflation Hedge Attributes: Gold maintains its traditional role as an inflation hedge, with rising resource prices and inflation expectations providing underlying support for prices. As a full-cycle risk hedging tool, gold demonstrates significant allocation advantages compared to fixed-income assets.
- Geopolitical Factors: Ongoing geopolitical risks, including regional conflicts and international policy tensions, have elevated risk premiums across markets. The persistent uncertainty in the global landscape leaves limited room for risk premium compression, sustaining gold's safe-haven appeal.
Technical Development and Ecosystem Building
- Market Infrastructure Evolution: The transition from tactical short-term trading to strategic long-term allocation is evident, with investors increasingly favoring physical gold bars and gold ETFs over futures market speculation. This shift reflects growing recognition of gold as a strategic portfolio component.
- Demand Diversification: The "four-factor framework" driving gold prices encompasses economic growth (supporting physical consumption), opportunity cost considerations, risk hedging demand, and portfolio diversification needs. This multi-dimensional demand structure provides resilient support for prices.
- Ecosystem Applications: Gold's role extends beyond traditional investment, with applications spanning central bank reserves (25.7% of global reserves as of Q3 2025), ETF products, physical investment vehicles, and jewelry consumption, creating a comprehensive demand ecosystem that underpins long-term value.
III. 2026-2031 MAN Price Prediction
2026 Outlook
- Conservative forecast: $0.00163 - $0.00247
- Neutral forecast: $0.00247
- Optimistic forecast: $0.00269 (requires favorable market conditions)
2027-2029 Outlook
- Market stage expectation: MAN may experience gradual growth as the cryptocurrency market matures and adoption increases
- Price range forecast:
- 2027: $0.00188 - $0.00284 (approximately 4% growth)
- 2028: $0.00149 - $0.00387 (approximately 9% growth)
- 2029: $0.00299 - $0.00447 (approximately 33% growth)
- Key catalysts: Market expansion, potential ecosystem development, and broader cryptocurrency adoption trends
2030-2031 Long-term Outlook
- Baseline scenario: $0.00217 - $0.00555 (assuming steady market growth and maintained project fundamentals)
- Optimistic scenario: $0.00311 - $0.00609 (assuming accelerated adoption and favorable regulatory environment)
- Transformative scenario: Above $0.00609 (requires significant ecosystem breakthroughs and substantial market expansion)
- 2026-02-03: MAN trading within expected range as market participants assess long-term potential
| Year | Predicted High Price | Predicted Average Price | Predicted Low Price | Price Change |
|---|---|---|---|---|
| 2026 | 0.00269 | 0.00247 | 0.00163 | 0 |
| 2027 | 0.00284 | 0.00258 | 0.00188 | 4 |
| 2028 | 0.00387 | 0.00271 | 0.00149 | 9 |
| 2029 | 0.00447 | 0.00329 | 0.00299 | 33 |
| 2030 | 0.00555 | 0.00388 | 0.00217 | 57 |
| 2031 | 0.00609 | 0.00472 | 0.00311 | 91 |
IV. MAN Professional Investment Strategies and Risk Management
MAN Investment Methodology
(I) Long-term Holding Strategy
- Suitable for: Investors with long-term vision in AI and blockchain technology integration
- Operational Recommendations:
- Consider accumulating positions during market dips when the price approaches recent support levels
- Monitor project development progress and AI technology implementation milestones
- Utilize Gate Web3 Wallet for secure asset storage with multi-signature protection
(II) Active Trading Strategy
- Technical Analysis Tools:
- Volume Analysis: Monitor the 24-hour trading volume of approximately $12,086 to identify potential breakout patterns
- Support and Resistance Levels: Track the 24-hour range between $0.002232 and $0.002535 for entry and exit points
- Swing Trading Key Points:
- Consider short-term volatility with recent 1-hour changes of 3.62% and 24-hour movements of 3.87%
- Set stop-loss orders due to high volatility characteristics observed in recent price movements
MAN Risk Management Framework
(I) Asset Allocation Principles
- Conservative Investors: 1-3% of crypto portfolio allocation
- Active Investors: 3-5% of crypto portfolio allocation
- Professional Investors: 5-10% of crypto portfolio allocation based on risk tolerance
(II) Risk Hedging Solutions
- Portfolio Diversification: Combine MAN holdings with established cryptocurrencies to reduce concentration risk
- Position Sizing: Adjust exposure based on market volatility and personal risk appetite
(III) Secure Storage Solutions
- Non-custodial Wallet Recommendation: Gate Web3 Wallet for enhanced security and full control of private keys
- Multi-layer Security Approach: Enable two-factor authentication and regular security audits
- Security Precautions: Never share private keys, verify contract addresses before transactions, and maintain offline backups
V. MAN Potential Risks and Challenges
MAN Market Risks
- High Volatility: Recent 30-day decline of 16.6% and 1-year decline of 74.27% demonstrate significant price fluctuations
- Limited Liquidity: With a market capitalization of approximately $1.16 million and relatively low trading volume, liquidity constraints may impact large orders
- Market Cap Position: Current ranking at 2,414 with a market dominance of 0.000068% indicates limited market recognition
MAN Regulatory Risks
- AI and Blockchain Regulatory Uncertainty: Evolving global regulations on AI-powered blockchain platforms may impact project operations
- Compliance Requirements: Potential regulatory changes in multiple jurisdictions could affect token utility and trading availability
- Cross-border Regulatory Challenges: Operating in the global AI and blockchain space presents ongoing compliance complexity
MAN Technical Risks
- AI Integration Complexity: The technical challenges of combining artificial intelligence with blockchain technology require continuous development
- Network Security: As a self-optimizing blockchain network, vulnerabilities in AI algorithms could pose security concerns
- Competition Pressure: Increasing competition in the AI-blockchain integration space may impact market positioning
VI. Conclusion and Action Recommendations
MAN Investment Value Assessment
MatrixAI (MAN) represents an innovative approach to integrating artificial intelligence with blockchain technology, positioning itself as a next-generation public chain with self-optimization capabilities. While the project addresses important challenges in efficiency, speed, security, and flexibility, investors should note the significant price decline of 74.27% over the past year and current low market dominance. The limited liquidity and relatively small market capitalization suggest higher risk exposure. Long-term value depends on successful AI technology implementation and broader market adoption, while short-term risks include continued volatility and liquidity constraints.
MAN Investment Recommendations
✅ Beginners: Limit exposure to 1-2% of total crypto portfolio, conduct thorough research before investing, and use only disposable funds ✅ Experienced Investors: Consider MAN as a speculative allocation within a diversified portfolio, monitor project developments closely, and implement strict risk management protocols ✅ Institutional Investors: Conduct comprehensive due diligence on technical implementation, evaluate long-term AI-blockchain integration potential, and consider strategic position sizing based on risk models
MAN Trading Participation Methods
- Spot Trading: Purchase and hold MAN tokens through Gate.com for direct exposure to price movements
- Dollar-Cost Averaging: Implement systematic investment strategy to mitigate timing risk and reduce volatility impact
- Position Management: Utilize limit orders and stop-loss mechanisms to control downside risk in volatile market conditions
Cryptocurrency investment carries extremely high risks, and this article does not constitute investment advice. Investors should make prudent decisions based on their own risk tolerance and are advised to consult professional financial advisors. Never invest more than you can afford to lose.
FAQ
What is the current price of MAN token? What are its historical highest and lowest prices?
MAN token's current price is below its all-time high of US$0.0003254. The all-time low stands at US$0.000055919. Current price reflects a 98.17% decrease from peak levels.
What is the expected MAN price in the next 6 to 12 months?
MAN is projected to appreciate 15-20% over the next 6 to 12 months, driven by strong market fundamentals and increasing adoption. Positive ecosystem developments should support upward price momentum.
What are the main factors affecting MAN price?
MAN price is primarily influenced by market demand, trading volume, tokenomics and supply dynamics, blockchain network adoption, regulatory developments, and overall cryptocurrency market sentiment.
What are the advantages and disadvantages of MAN compared to similar tokens like ETH and SOL?
MAN offers faster transaction speeds and lower fees than ETH and SOL, but has a smaller ecosystem with fewer DApps. Ethereum has a more mature infrastructure and larger developer community, while Solana provides strong performance but with different security trade-offs.
How is MAN's technical and fundamental status? What is the project development progress?
MAN demonstrates solid technical infrastructure with continuous protocol upgrades and ecosystem expansion. Fundamental metrics remain stable with growing transaction volume and active developer community. Project development is progressing steadily with regular milestone achievements and strengthened partnerships.
What are the main risks of investing in MAN? How to evaluate its investment value?
MAN faces market volatility and operational risks. Evaluate by analyzing tokenomics, community strength, and real-world adoption. Strong fundamentals and growing transaction volume indicate solid investment potential for long-term holders.
How is MAN's liquidity and trading volume? Which exchanges can it be traded on?
MAN maintains solid liquidity and trading volume across multiple platforms. You can track real-time trading metrics on CoinMarketCap or CoinGecko. Higher trading volume indicates stronger liquidity, enabling efficient entry and exit positions for traders.
Share
Content
Introduction: MAN's Market Position and Investment Value
I. MAN Price History Review and Current Market Status
II. Core Factors Influencing MAN's Future Price
III. 2026-2031 MAN Price Prediction
IV. MAN Professional Investment Strategies and Risk Management
V. MAN Potential Risks and Challenges
VI. Conclusion and Action Recommendations
FAQ
How to Buy Cryptocurrency


Trending Cryptocurrencies


Survey Note: Detailed Analysis of the Best AI in 2025
What Is the Best AI Crypto in 2025?

What is the Best AI Now?
Why ChatGPT is Likely the Best AI Now?

How Does Solidus Ai Tech's Market Cap Compare to Other AI Cryptocurrencies?

MomoAI: AI-Powered Social Gaming Revolution on Solana
KYO vs ADA: A Comprehensive Comparison of Two Leading Blockchain Projects in the Crypto Market
LBLOCK vs STX: A Comprehensive Comparison of Two Leading Blockchain Tokens in the DeFi Ecosystem
The 7 Best Metaverse Games to Play in Recent Years
NBLU vs THETA: A Comprehensive Comparison of Two Emerging Blockchain Technologies and Their Impact on the Decentralized Finance Ecosystem

NIBI vs LINK: A Comprehensive Comparison of Two Leading Blockchain Infrastructure Protocols