HashPack (PACK) is a non-custodial wallet utility token on Hedera Hashgraph, currently trading at $0.006005 with extreme market fear (Fear Index: 14). This comprehensive analysis examines PACK's price trajectory from 2026-2031, combining historical patterns, supply dynamics, and ecosystem development. The article projects conservative 2026 prices at $0.00413-$0.00599, with potential growth to $0.01801 by 2031 under favorable conditions. Key drivers include Hedera ecosystem adoption, production line automation trends, and macroeconomic factors. Investment strategies range from long-term holding for believers in Web3 infrastructure to active swing trading. Critical risks include high volatility (1-year decline of 83%), limited liquidity ($17,482 daily volume), and regulatory uncertainty. The token suits risk-tolerant investors allocating 1-8% of crypto portfolios, with secure storage via Gate Web3 Wallet recommended for position management.
Introduction: PACK's Market Position and Investment Value
HashPack (PACK), as a leading non-custodial wallet solution on the Hedera Hashgraph network, has been serving the DeFi, NFT, and dApp communities since its launch in 2024. As of 2026, PACK maintains a market capitalization of approximately $1.40 million, with around 232.68 million tokens in circulation, and the price hovering around $0.006005. This asset, recognized as a cornerstone infrastructure component within the Hedera ecosystem, is playing an increasingly vital role in providing seamless user experiences for retail users and developers across decentralized applications.
This article will comprehensively analyze PACK's price trends from 2026 to 2031, combining historical patterns, market supply and demand dynamics, ecosystem development, and macroeconomic conditions to provide investors with professional price forecasts and practical investment strategies.
I. PACK Price History Review and Current Market Status
PACK Historical Price Evolution Trajectory
- 2024: HashPack token (PACK) was launched on May 21, 2024, with an initial offering price of $0.015, and reached a peak of $0.08778 on November 17, 2024, representing a significant increase from its launch price
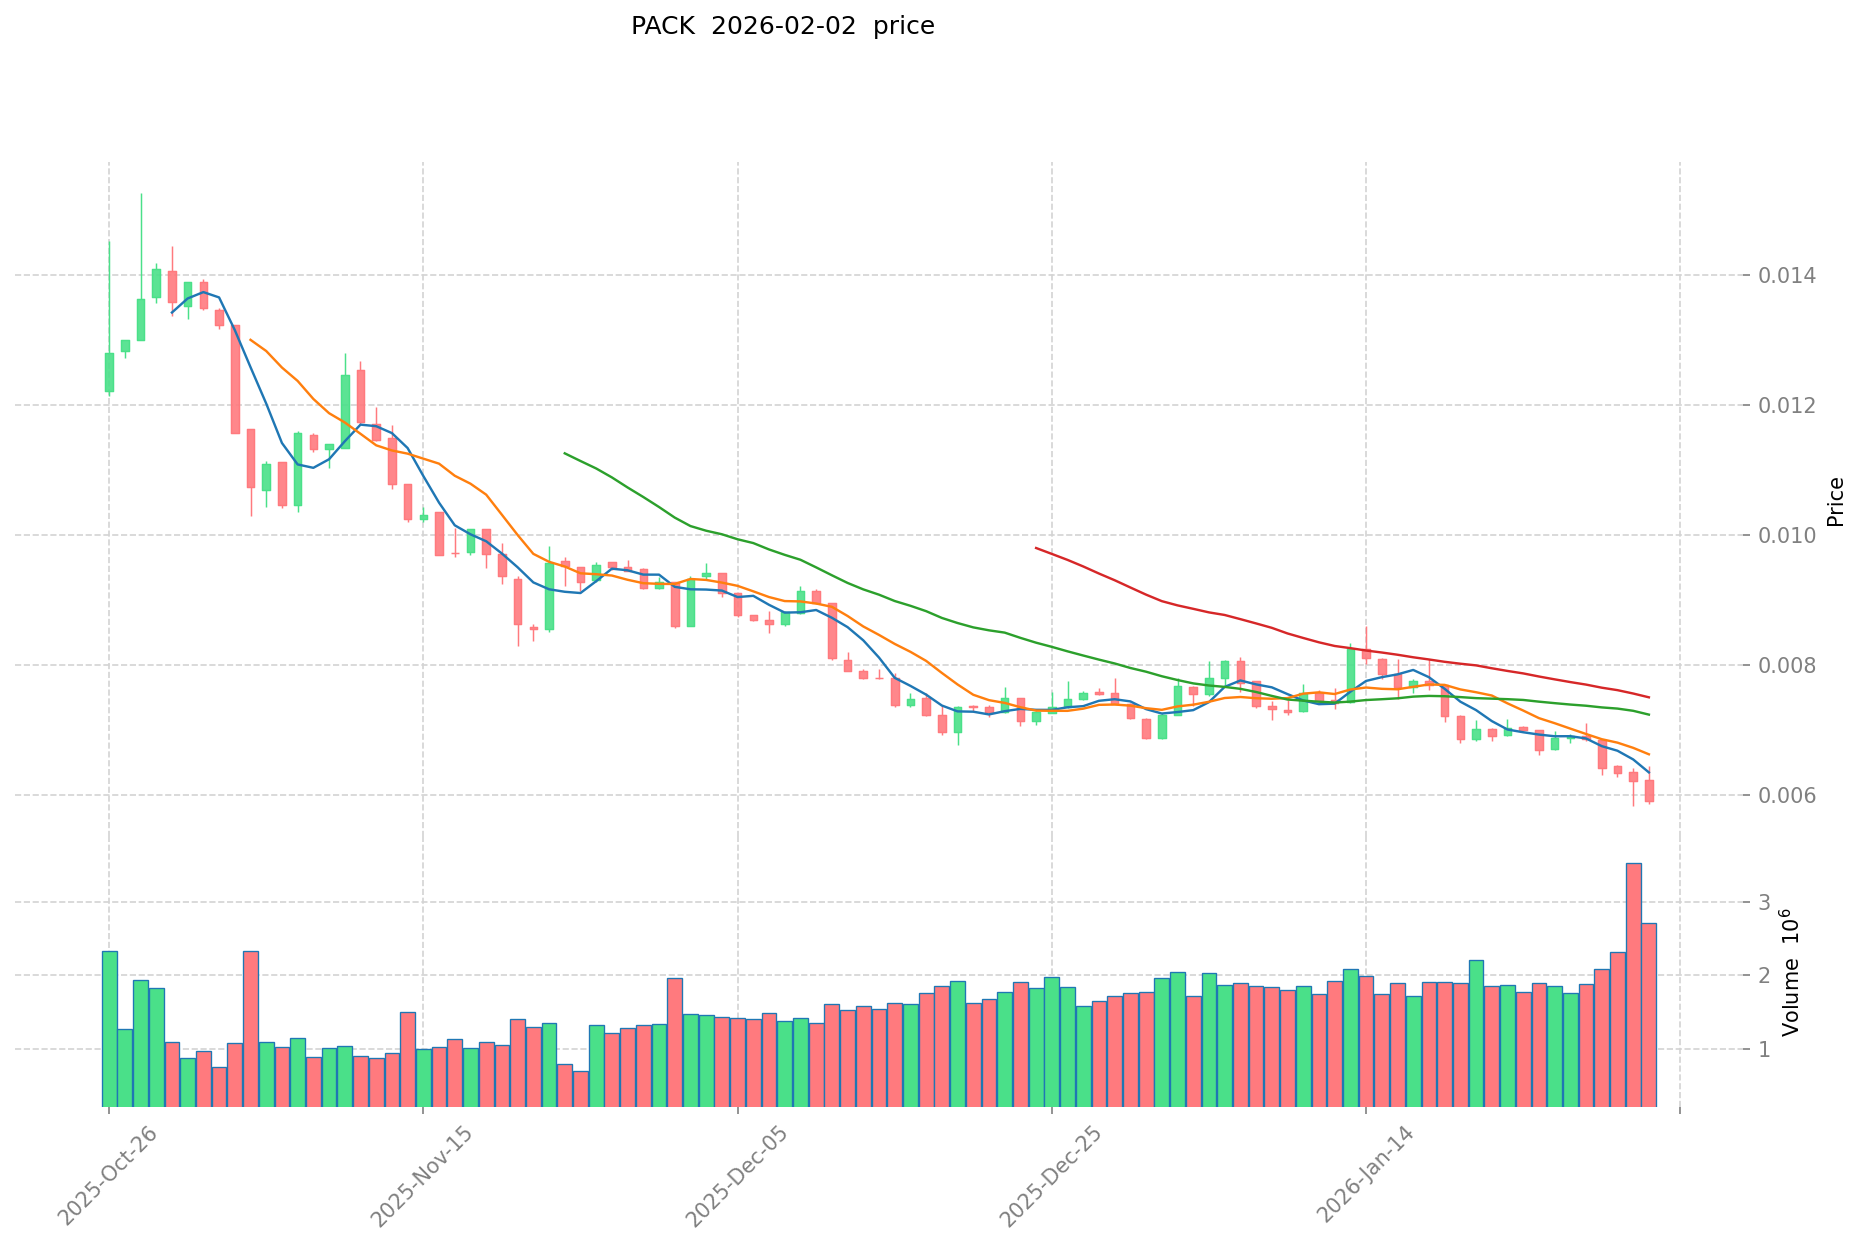
- 2025-2026: The token experienced a downward trend, declining from its historical high point
- 2026: As of February 2, 2026, PACK reached $0.005747, reflecting substantial price adjustment from previous levels
PACK Current Market Status
As of February 2, 2026, PACK is trading at $0.006005, with a 24-hour trading volume of $17,482.80. The token has shown mixed short-term performance, with a 1-hour increase of 1.3%, while experiencing declines of 0.89% over 24 hours, 12.35% over 7 days, and 18.82% over 30 days.
The current circulating supply stands at 232.68 million PACK tokens, representing 23.27% of the maximum supply of 1 billion tokens. The market capitalization is approximately $1.40 million, while the fully diluted valuation reaches $6.01 million. PACK maintains a market dominance of 0.00021%.
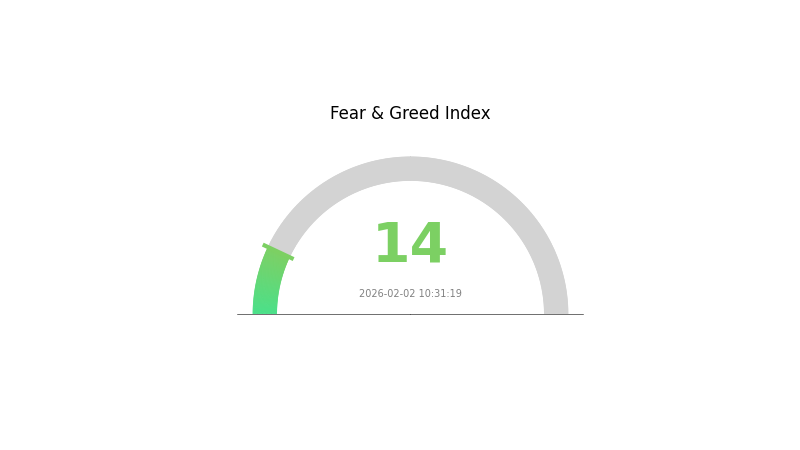
The cryptocurrency market sentiment index currently reads 14, indicating an environment of extreme fear among market participants. PACK is trading within a 24-hour range, with a high of $0.006438 and a low of $0.005747.
HashPack functions as a non-custodial wallet solution on Hedera Hashgraph, providing user experience for DeFi applications, NFT management, and dApp interactions. The platform has been audited and offers account creation options through both email and seed phrase methods. HashPack has achieved integration with various dApps within the Hedera Hashgraph ecosystem.
Click to view current PACK market price
PACK Market Sentiment Index
2026-02-02 Fear and Greed Index: 14 (Extreme Fear)
Click to view current Fear & Greed Index
The crypto market is currently experiencing extreme fear, with the Fear and Greed Index at just 14 points. This historically low reading suggests significant market pessimism and widespread investor anxiety. Such extreme fear levels often present contrarian opportunities, as markets may be oversold. Experienced traders sometimes view these conditions as potential accumulation periods before potential recoveries. However, caution remains advisable during high volatility. Stay informed about market dynamics and consider your risk tolerance before making trading decisions on Gate.com.
PACK Holding Distribution
The holding distribution chart represents the concentration of token supply across different wallet addresses, serving as a crucial indicator of token ownership decentralization. By analyzing the distribution pattern among top holders, we can assess the potential risks associated with supply concentration and the overall health of the token's market structure.
Based on the current data, PACK exhibits a relatively concentrated holding pattern among top addresses. The top 10 addresses collectively control a significant portion of the total circulating supply, indicating moderate to high concentration levels. This distribution pattern suggests that large holders possess substantial influence over market dynamics, potentially creating vulnerability to coordinated selling pressure or market manipulation activities. The presence of dominant whale positions typically correlates with increased volatility risk, as large-scale transactions from these addresses can trigger cascading market effects.
From a market structure perspective, the current holding distribution reflects limited decentralization in token ownership. While some degree of concentration is common in early-stage projects or tokens with specific utility purposes, excessive centralization can undermine price stability and investor confidence. The existing concentration levels may amplify price volatility during periods of market stress, as decisions by a small number of large holders can disproportionately impact trading dynamics. However, this pattern does not necessarily indicate malicious intent—institutional holdings, foundation reserves, or ecosystem development allocations can legitimately contribute to concentrated distribution.
Click to view current PACK Holding Distribution

| Top |
Address |
Holding Qty |
Holding (%) |
II. Core Factors Affecting Future PACK Prices
Supply Mechanism
-
Automated Production Line Adoption: The PACK market is experiencing a transition from traditional manual assembly to automated production lines. This shift is driven by policy support for smart manufacturing, rising labor costs, and economic pressures prompting enterprises to pursue automation. The automation rate of module/PACK production lines is expected to increase progressively from 40% to 90% between 2020 and 2025.
-
Historical Pattern: Historically, automation adoption in manufacturing has led to initial capital expenditure increases followed by long-term cost reductions and quality improvements. In the lithium battery equipment sector, automation has consistently driven market expansion through efficiency gains.
-
Current Impact: The domestic module/PACK production line market is projected to reach 11.3 billion yuan by 2025, with a compound annual growth rate of 55% over five years. This rapid expansion in automated production capacity will significantly influence PACK pricing through improved efficiency and scale economics.
Institutional and Major Player Dynamics
-
Industry Investment: Major lithium battery manufacturers and new energy vehicle companies are substantially increasing their fixed asset investments in PACK production lines. The global market for module/PACK automation equipment is expected to reach 24.9 billion yuan by 2025, with a compound growth rate of 38%.
-
Enterprise Adoption: Leading enterprises in the new energy vehicle sector, including major battery manufacturers, are rapidly expanding their PACK production capabilities. The market is seeing accelerated adoption across China, the United States, and European markets.
-
Policy Support: Government policies promoting intelligent manufacturing equipment have played a decisive role in early-stage development. Continued policy emphasis on smart manufacturing and Industry 4.0 concepts drives enterprises toward automation upgrades and production quality improvements.
Macroeconomic Environment
-
New Energy Vehicle Growth: The primary demand driver is the rapid growth in new energy vehicle sales. Under carbon neutrality policies, China's new energy vehicle penetration rate is expected to increase from 13% in 2021 to 39% by 2025. This sustained electrification trend directly drives demand for PACK production equipment.
-
Labor Cost Dynamics: Population structure changes and rising labor costs provide crucial momentum for smart manufacturing equipment to replace manual labor. Economic slowdown and industrial structure adjustments create both pressure and opportunity for enterprises to adopt automation.
-
Economic Structure Adjustment: As the economy transitions toward high-quality development, enterprises face survival pressures that promote automated operations. Simultaneously, increased requirements for production precision and quality actively drive enterprises to seek automation transformation.
Technology Development and Ecosystem Construction
-
Lithium Battery Technology Advancement: Single production line capacity is expected to increase from 2.4 GWh in 2020 to 4.5 GWh by 2025, reflecting significant technological progress in lithium battery manufacturing efficiency and scale.
-
Production Process Innovation: The PACK production line represents the backend process of lithium battery equipment, encompassing formation, capacity grading, testing, and assembly stages. Continuous innovation in module assembly and PACK assembly technologies enhances production efficiency and product quality.
-
Ecosystem Expansion: Beyond traditional automotive applications, the market is expanding into new sectors including energy storage and fuel cell assembly. This diversification of application scenarios creates additional growth opportunities for PACK production equipment and influences long-term pricing dynamics through market expansion.
III. 2026-2031 PACK Price Prediction
2026 Outlook
- Conservative prediction: $0.00413 - $0.00599
- Neutral prediction: $0.00599 average price level
- Optimistic prediction: $0.00701 (requires favorable market conditions)
2027-2029 Outlook
- Market stage expectation: The token may enter a gradual growth phase as adoption potentially expands and market sentiment stabilizes
- Price range prediction:
- 2027: $0.00358 - $0.00956, average around $0.0065
- 2028: $0.00747 - $0.01012, average around $0.00803
- 2029: $0.00581 - $0.01225, average around $0.00907
- Key catalysts: Increased adoption rates, ecosystem development progress, and broader cryptocurrency market trends could serve as primary drivers
2030-2031 Long-term Outlook
- Baseline scenario: $0.00565 - $0.01418 (assuming steady market conditions and continued project development)
- Optimistic scenario: $0.01066 - $0.01418 in 2030 (contingent on strong ecosystem growth and positive regulatory environment)
- Growth scenario: $0.00633 - $0.01801 by 2031 (under favorable market conditions with significant adoption increase)
- 2026-02-02: PACK trading within the predicted early-year range as market participants assess long-term potential
| Year |
Predicted High Price |
Predicted Average Price |
Predicted Low Price |
Price Change |
| 2026 |
0.00701 |
0.00599 |
0.00413 |
0 |
| 2027 |
0.00956 |
0.0065 |
0.00358 |
8 |
| 2028 |
0.01012 |
0.00803 |
0.00747 |
33 |
| 2029 |
0.01225 |
0.00907 |
0.00581 |
51 |
| 2030 |
0.01418 |
0.01066 |
0.00565 |
77 |
| 2031 |
0.01801 |
0.01242 |
0.00633 |
106 |
IV. PACK Professional Investment Strategy and Risk Management
PACK Investment Methodology
(1) Long-term Holding Strategy
- Target Investors: Investors who believe in the Hedera ecosystem development and Web3 wallet infrastructure innovation
- Operational Recommendations:
- Accumulate positions during price corrections of 10-15% or more to lower average cost
- Monitor HashPack's integration progress with major dApps in the Hedera ecosystem and user growth metrics
- Use Gate Web3 Wallet for secure, non-custodial storage with multi-signature protection enabled
(2) Active Trading Strategy
- Technical Analysis Tools:
- Moving Averages: Track 7-day and 30-day moving averages; consider accumulating when price crosses above the 7-day MA with increasing volume
- Volume Analysis: Monitor 24-hour trading volume trends; volume spikes above $20,000 may signal potential breakout opportunities
- Swing Trading Key Points:
- Set stop-loss orders 8-12% below entry price to manage downside risk
- Take partial profits at 15-20% gains while maintaining core position for potential extended rallies
PACK Risk Management Framework
(1) Asset Allocation Principles
- Conservative Investors: 1-3% of crypto portfolio
- Aggressive Investors: 5-8% of crypto portfolio
- Professional Investors: Up to 10% with active hedging strategies
(2) Risk Hedging Solutions
- Diversification Strategy: Balance PACK holdings with established assets like HBAR and other ecosystem tokens
- Position Sizing: Implement dollar-cost averaging to reduce timing risk during volatile periods
(3) Secure Storage Solutions
- Non-Custodial Wallet Recommended: Gate Web3 Wallet with hardware wallet integration support
- Cold Storage Option: Transfer long-term holdings to hardware wallets with seed phrase backup stored securely offline
- Security Precautions: Never share seed phrases, enable two-factor authentication, and verify all transaction details before confirming
V. PACK Potential Risks and Challenges
PACK Market Risks
- High Volatility: PACK has experienced significant price fluctuations with a 1-year decline of approximately 83%, indicating substantial volatility exposure
- Low Trading Volume: 24-hour trading volume of approximately $17,482 suggests limited liquidity, which may result in wider bid-ask spreads and slippage
- Limited Exchange Availability: Currently listed on only one exchange, which concentrates liquidity risk and reduces trading flexibility
PACK Regulatory Risks
- Wallet Service Regulation: Potential regulatory changes affecting non-custodial wallet services could impact HashPack's operational model
- Compliance Requirements: Evolving KYC/AML requirements may affect wallet accessibility in certain jurisdictions
- Hedera Network Compliance: Regulatory developments affecting the Hedera network could indirectly impact PACK utility and adoption
PACK Technical Risks
- Smart Contract Vulnerabilities: Despite being audited, potential undiscovered vulnerabilities in wallet infrastructure could pose security risks
- Network Dependency: PACK's value is closely tied to Hedera Hashgraph network performance and adoption trajectory
- Competition Risk: Emerging wallet solutions in the Hedera ecosystem or cross-chain alternatives may affect HashPack's market position
VI. Conclusion and Action Recommendations
PACK Investment Value Assessment
HashPack (PACK) represents a specialized opportunity within the Hedera ecosystem, functioning as a utility token for a non-custodial wallet with strong dApp integration. Long-term value proposition depends on Hedera's ecosystem growth and HashPack's ability to maintain its leading position among retail wallets. However, short-term risks include significant price volatility, limited liquidity with low trading volumes, and concentration risk from single-exchange availability. The token has declined substantially over the past year, reflecting broader market challenges and early-stage project risks.
PACK Investment Recommendations
✅ Beginners: Consider allocating no more than 1-2% of crypto portfolio to PACK, focusing on understanding Hedera ecosystem fundamentals before investing
✅ Experienced Investors: May allocate 3-5% with active monitoring of HashPack development milestones and ecosystem integration progress
✅ Institutional Investors: Evaluate PACK as a tactical position within broader Hedera ecosystem exposure, implementing robust risk controls and liquidity management protocols
PACK Trading Participation Methods
- Spot Trading: Purchase PACK on available exchanges with limit orders to manage execution price in low-liquidity conditions
- Dollar-Cost Averaging: Implement systematic periodic purchases to reduce timing risk and smooth entry price over time
- Ecosystem Research: Monitor HashPack user growth metrics, dApp integration announcements, and Hedera network developments for informed decision-making
Cryptocurrency investment carries extremely high risks, and this article does not constitute investment advice. Investors should make cautious decisions based on their own risk tolerance and are advised to consult professional financial advisors. Never invest more than you can afford to lose.
FAQ
What is PACK token and what are its practical uses?
PACK is a utility token that rewards Hedera wallet users. It can be used to purchase cosmetics in their store and provides staking bonuses for NFT holders, offering real functional value within the ecosystem.
How to analyze PACK's historical price trends and market trends?
Analyze PACK's historical price by reviewing K-line charts and price data to identify recurring market patterns. Study trading volume fluctuations and support/resistance levels. Use technical indicators to recognize trends, enabling informed predictions of future price movements based on historical market behavior patterns.
What are the main factors affecting PACK price?
PACK price is primarily influenced by market demand, trading volume, project developments, and overall market sentiment in the crypto sector. Token utility, adoption rate, and macroeconomic conditions also play significant roles in price movements.
What technical indicators and fundamentals should be monitored for PACK price prediction?
Monitor technical indicators including MACD, RSI, and moving averages for price trends. On fundamentals, track trading volume, market sentiment, ecosystem developments, and token utility adoption to assess PACK's long-term value potential.
What risks should be noted when investing in PACK tokens?
PACK token investments carry market volatility risk, potential liquidity constraints, and regulatory uncertainty. Token value may fluctuate significantly based on market conditions and project developments. Investors should conduct thorough research before participating.
PACK与其他类似代币相比有什么优势和劣势?
PACK features enhanced security through its unique consensus mechanism and improved transaction efficiency. However, it may face scalability constraints in larger network environments compared to some competing tokens.
What is the price expectation for PACK from professional analysts?
Professional analysts forecast PACK price targets ranging from $7 to $15. Current market conditions show downward pressure, but analysts remain optimistic about potential upside recovery in the medium term as fundamentals stabilize.
* The information is not intended to be and does not constitute financial advice or any other recommendation of any sort offered or endorsed by Gate.