Hyperliquid (HYPE) retreats to a key support zone as selling pressure increases
As of Thursday, Hyperliquid (HYPE) has retreated below the 50-day Exponential Moving Average (EMA) around the $28.85 mark, extending its correction of nearly 10% since the beginning of the week. Notably, buying pressure in the derivatives market is showing clear signs of weakening, allowing short positions to increase and dominate.
In this context, the 50-day EMA is considered an important technical “line of defense,” playing a key role in determining HYPE’s short-term trend in the near future.
Bears tighten retail investor sentiment on HYPE
Hyperliquid (HYPE) – the token of a decentralized exchange (DEX) specializing in perpetual contracts – is showing signs of losing momentum as demand from retail investors weakens significantly. According to CoinGlass data, the open interest (OI) of HYPE futures has decreased by about 2% in 24 hours, down to $1.34 billion. This indicates that many traders are actively closing positions, possibly due to forced liquidation pressures or a trend of reducing leverage amid unfavorable market conditions.
Alongside the decline in OI, the total value of long positions liquidated during the same period has reached $3.07 million, far exceeding the $228,950 of short positions. This large discrepancy clearly reflects a market phenomenon where traders are “hunting” for long positions in the HYPE derivatives market. The liquidation pressure heavily favors the bulls, causing the long/short ratio to drop to 0.9037, below the equilibrium level of 1, indicating that bears are gradually gaining the upper hand and market sentiment continues to lean toward caution.
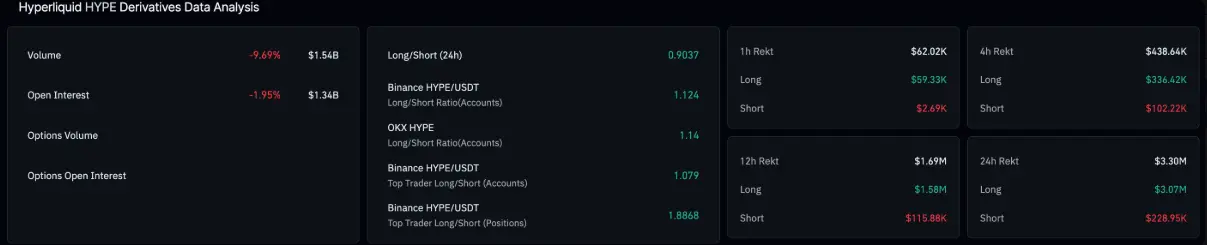 HYPE Derivatives Data | Source: CoinGlass## Will HYPE hold the 50-day EMA?
As of Thursday, Hyperliquid has lost a critical support level by falling below the 50-day EMA at $28.85, recording nearly a 1% decline during the session. Breaking through this short-term moving average — while it remains below the 200-day EMA at $32.75 — signals that the trend structure is firmly tilted toward the bearish side.
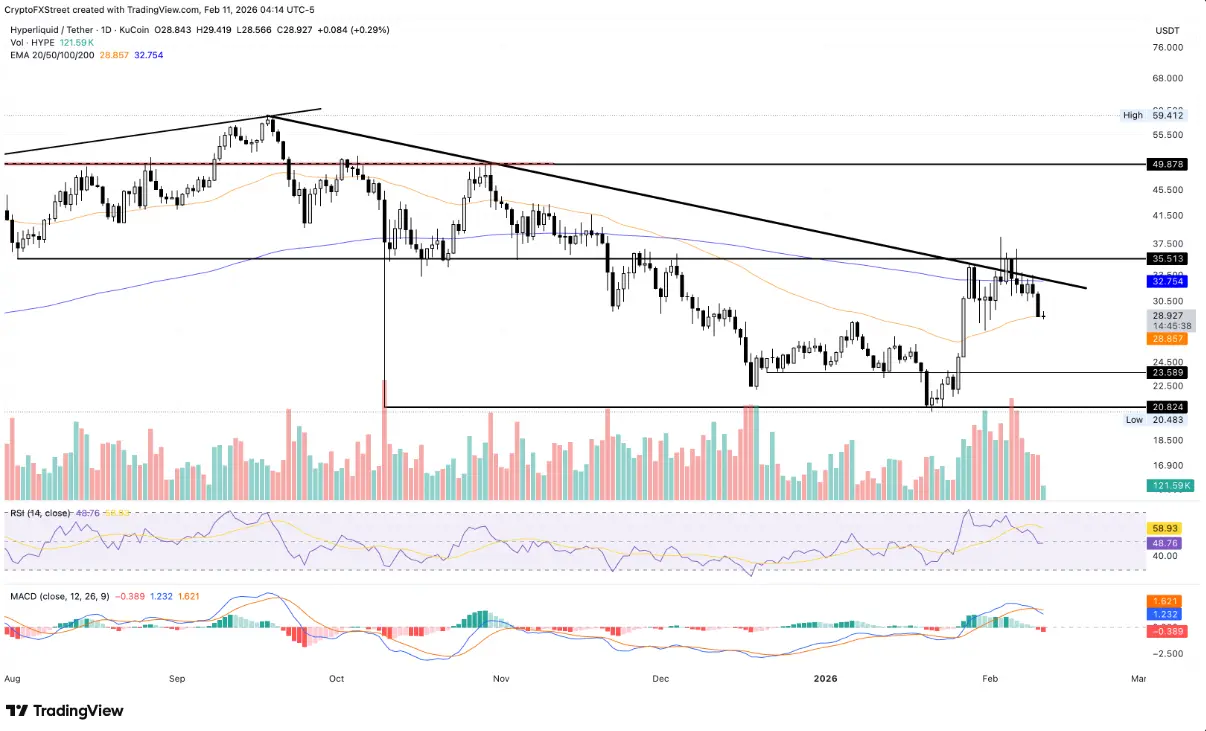 Daily HYPE/USDT Chart | Source: TradingView If the daily close remains below $28.85, the breakdown scenario will be confirmed, opening the risk of a deeper plunge toward the support zone at $23.58, the low set on December 21. If selling pressure increases, the $20.82 level — the October 10 low — will serve as the next strong defensive line for the market.
Technical indicators also reinforce the negative outlook. The daily MACD has reversed downward and formed a bearish crossover earlier this week, with the histogram continuing to expand in the negative, reflecting a weakening momentum. Meanwhile, the RSI has fallen back to 48 and dropped below the neutral threshold after leaving the overbought zone, indicating that selling still dominates and room for further decline remains.
However, if HYPE can recover and close above the 50-day EMA at $28.85, short-term downward pressure will ease, creating an opportunity for the price to rebound and challenge the 200-day EMA at $32.75.
Related Articles
ASTER Eyes 25% Rally, But Only If Key Conditions Hold
The four tech giants' 2026 investment bets: Copper rises, oil falls, new crypto paradigm replaces gold and Bitcoin
Aster (ASTER) To Rise Higher? Key Harmonic Pattern Signals Potential Upside Move
XRP Price Prediction: Analysts Reveal $7 Potential Target Price Using Silver Bull Market Model
Bitcoin vs Gold: How to Choose Safe-Haven Assets in 2026, the Year of the Horse? Insights from Yen Arbitrage Trading on Inflation Hedge Strategies