XRP Today's News: ETF Zero Outflows Outperform BTC, CPI Data Becomes the Key Catalyst

XRP follows the overall cryptocurrency market downward, currently at $1.36. However, in terms of capital flow, XRP ETF has experienced eight consecutive days of zero outflows, while Bitcoin has seen outflows of $276 million. Unemployment claims have dropped to 227,000, with the Federal Reserve’s probability of rate cuts in March rising to 7.8% and in June to 63.9%. Looking ahead, Friday’s CPI data release will be a key factor.
XRP ETF Decouples from Bitcoin, Mainstream Crypto Capital Diverges
Although expectations of Fed rate cuts have weakened, dampening retail investor sentiment, the capital flow trend in the US XRP spot ETF market shows institutional demand remains strong. On February 12, the US XRP spot ETF net inflow was zero, avoiding net outflows for the eighth consecutive trading day. In contrast, the US Bitcoin spot ETF experienced net outflows of $276 million.
This stark contrast—“zero outflow vs. $276 million outflow”—is the core reason for XRP’s relative resilience. Zero outflow indicates no institutional redemption of XRP ETFs, with all holders holding their positions. This steadfastness may stem from confidence in XRP’s long-term prospects, belief that current prices are at a bottom worth holding, or simply because losses are too deep to admit defeat (average cost of XRP ETF holdings is about $3,500, current price is $1.36, with approximately 61% loss).
Notably, since trading began in November, the US XRP spot ETF has outperformed the US Bitcoin spot ETF. The XRP ETF issuer reports net inflows of $1.23 billion, while the Bitcoin ETF issuer faced net outflows of $4.6 billion during the same period. This divergence—“XRP inflow of $1.23 billion vs. Bitcoin outflow of $4.6 billion”—is the most noteworthy data point in today’s news.
Given Bitcoin’s status as a market barometer, large capital outflows have suppressed interest in digital assets. Although the Bitcoin spot ETF market is much larger than XRP’s, the capital flow trend reflects institutional sentiment. When institutions withdraw heavily from Bitcoin ETFs, the overall risk appetite in the crypto market declines. While XRP avoided outflows, it still cannot be entirely immune.
Initial Jobless Claims Drop to 227,000: Double-Edged Effect
On February 12, US labor market data drew widespread attention, following a better-than-expected employment report released Wednesday. Initial unemployment claims fell from 232,000 in the week ending January 31 to 227,000 in the week ending February 7, above the market consensus of 222,000. Still, 227,000 remains near historic lows.
Notably, influenced by this data, XRP’s price briefly surged to a high of $1.4025 before retreating to an intraday low of $1.3463. Although the decline was smaller than expected, the drop in initial jobless claims indicates a resilient labor market, challenging the Fed’s expectation of rate cuts in the first half of 2026. The logic of “good data → distant rate cuts → XRP declines” dominated the day’s trend.
According to CME’s FedWatch tool, the probability of a rate cut in March increased from 6.4% on February 11 to 7.8% on February 12. The probability of a June rate cut also rose from 57.6% to 63.9%. Despite the increase, the likelihood of a rate cut on that day remains below the 75% seen on February 5, indicating market sentiment is shifting toward a more hawkish Fed outlook. Delayed rate cuts will keep credit conditions tighter, suppressing speculative and leveraged positions in XRP and the broader crypto market.
CPI Release on Friday Will Be a Key Catalyst
Looking ahead, the US CPI report will be the next critical catalyst. If the data exceeds expectations (above 0.3% month-over-month), it will further dampen rate cut expectations, potentially pushing XRP to test support at $1.00. If it comes in below expectations (below 0.3%), risk appetite may temporarily improve, and XRP could rebound toward $1.50.
Meanwhile, regulatory developments related to crypto are crucial for XRP’s outlook. If stablecoin yields reach an agreement, it could boost expectations for the Senate passing the Market Structure Bill, thereby increasing XRP demand. The 17% decline in XRP in February reaffirms a short-term (1-4 weeks) negative outlook targeting $1.00. However, strong spot ETF buying, market expectations of Senate approval, and increased XRP utility all reinforce medium- and long-term bullish prospects: $2.5 in 4-8 weeks, and $3.0 in 8-12 weeks.
These scenarios over the next 12 weeks could push XRP toward its all-time high of $3.66, with a breakout confirming a 6-12 month target of $5.
Technical Breakdown: XRP Breaks Below 50-Day and 200-Day Moving Averages, Turning Bearish
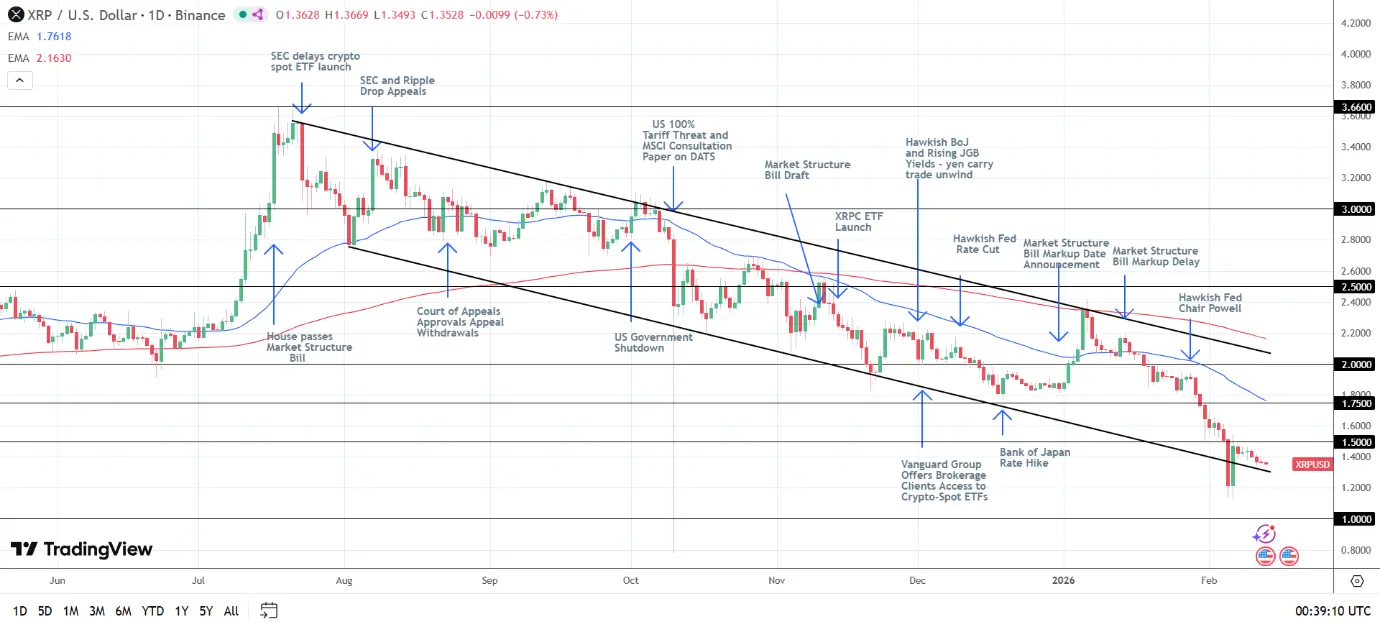
(Source: TradingView)
On February 12, XRP declined 0.52%, following a 2.14% drop the previous day, closing at $1.3627. The token’s movement aligns with the overall crypto market, which fell 0.61%. Three consecutive days of decline have caused XRP to break below its 50-day and 200-day moving averages, indicating strong downward momentum. However, multiple positive fundamental factors continue to offset technical negatives, supporting a medium-term bullish outlook.
Key technical levels to watch include: support at $1.00 and then $0.7773; resistance at the 50-day moving average of $1.7618; resistance at the 200-day moving average of $2.1630; and resistance levels at $1.50, $2.0, $2.5, and $3.0. On the daily chart, if the price breaks above $1.50, bulls could target the 50-day moving average. Continued breakout above this level would suggest a potential short-term trend reversal. Once the trend reverses upward, the 200-day moving average will come into play. Persistent breaks above EMA averages will confirm a bullish trend reversal.
The ongoing reversal in XRP consolidates the existing downtrend. If the price breaks below the downtrend line, the low of $1.1227 from February 6 will serve as support again. A break below that would make $1.00 the next key support. Falling below $1.00 would strengthen the short-term bearish outlook and further validate the bearish structure. Conversely, if the price breaks above $1.50, it could rise further toward $2.0 and test the upper trendline.
Related Articles
Whale 3NVeXm Deposits Additional 2,035 BTC Worth $135.23M to Centralized Exchange
Data: Bitcoin spot ETF experienced a net outflow of $410.57 million yesterday
Ethereum ETF Holders Stare at 43% Losses as ETH Tumbles Below $2,000—Far Worse Than Bitcoin ETF
This week's mining data highlights: Bitcoin mining difficulty experienced the largest single adjustment since summer 2021; Cangu has raised an additional $75.5 million, focusing on transforming into an AI distributed computing platform.