Buy signal lit up, but XRP still hasn't escaped the downtrend
Ripple (XRP) experienced a slight correction at the time of writing on Wednesday, falling from the day’s opening level of $1.48, amid a cautious market sentiment that continues to dominate the entire cryptocurrency market. Currently, a short-term support zone is gradually forming around the $1.45 level. However, increasing bearish pressure from sell positions risks further weakening the derivatives market, thereby prolonging the price correction.
Divergent Outlook as Retail Demand for XRP Weakens
XRP is struggling to maintain its recovery momentum, while prices are continuously fluctuating sharply due to inconsistent interest from retail investors. After XRP futures open interest (OI) surged to $2.56 billion on Monday, this figure narrowed to $2.53 billion just one day later. This development somewhat dampened last week’s optimism — the momentum that helped XRP climb to $1.67 on Sunday.
Notably, OI remains well below the all-time high of $10.94 billion recorded in July. The decline in OI indicates traders are collectively reducing their positions and becoming cautious about opening new trades, making XRP more vulnerable to psychological shocks and risk-avoidance pressures in the market.
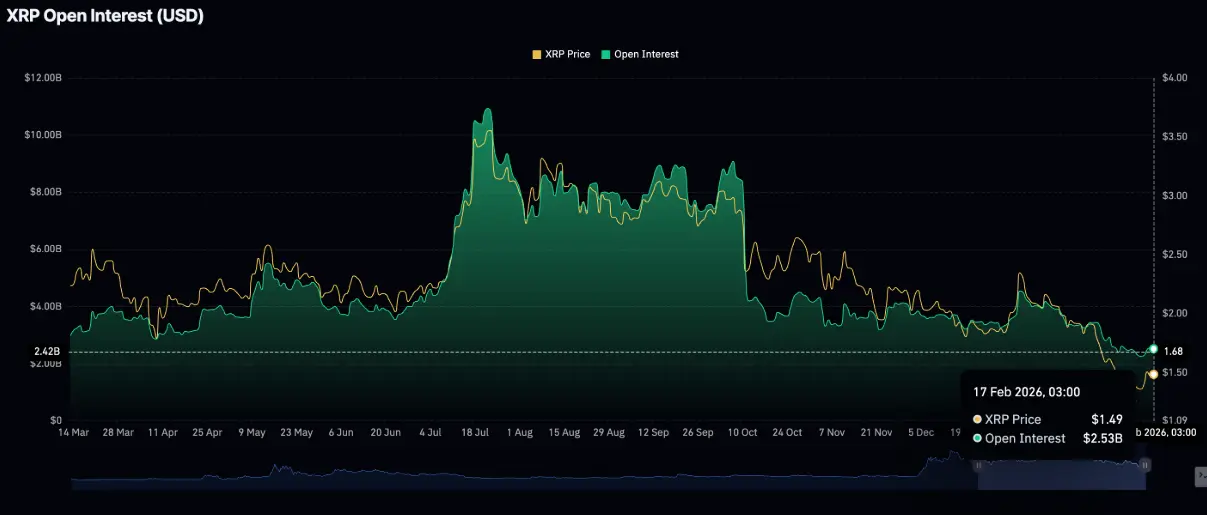 XRP Futures Open Interest (OI) | Source: CoinGlass According to data from CoinGlass, short positions are increasingly dominant, reflecting waning confidence in XRP’s short-term bullish prospects. The weighted funding rate based on OI stayed at -0.0078% on Wednesday and has been in negative territory since Sunday. In the absence of clear breakout momentum, XRP’s price is likely to continue experiencing high volatility, as the overall market trend remains bearish.
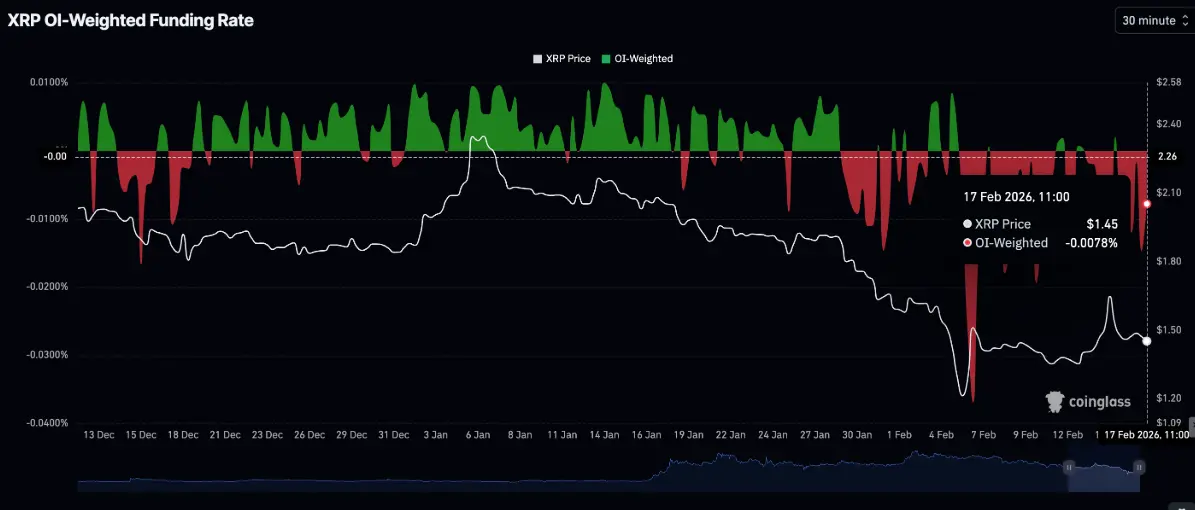 XRP Funding Rate by Open Interest (OI) | Source: CoinGlass
Technical Outlook: Assessing XRP Market Structure
XRP is currently oscillating around the $1.45 level, but remains quite distant from key exponential moving averages (EMAs). Specifically, the price is below the 50-day EMA at $1.72, the 100-day EMA at $1.93, and the 200-day EMA around $2.13. The fact that all three EMAs are trending downward indicates a clear weakening of the technical structure, increasing the likelihood that the current correction trend will continue in the near future.
On the momentum front, the RSI stands at 40.76 and remains below the daily midpoint, limiting the room for a price rebound. However, initial positive signals have started to emerge as the MACD crosses above its signal line. The expanding green histogram bars suggest improving momentum, which could encourage traders to re-enter the market — especially if XRP holds the short-term support zone at $1.45, a level that was successfully tested earlier this week.
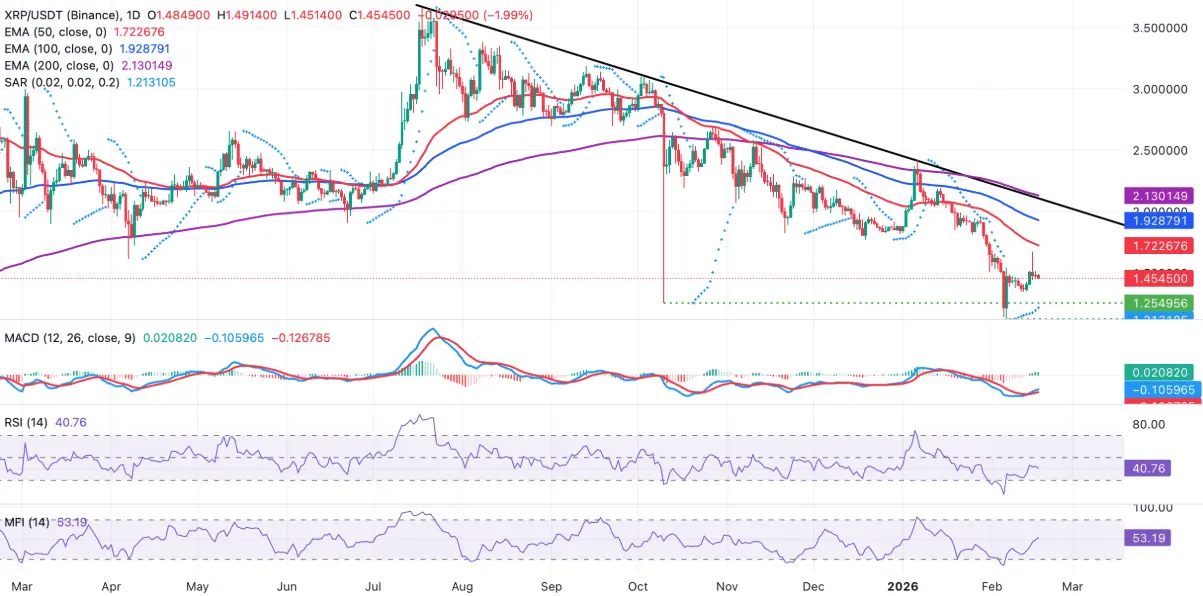 Daily XRP/USDT Chart | Source: TradingView
Nevertheless, XRP’s recovery is likely to face significant resistance from the downward trendline formed since the all-time high of $3.66, with notable resistance around the $2.10 level. On the support side, the Parabolic SAR indicator is currently below the price at $1.21, serving as an initial technical support point; if this level is broken, the downtrend could continue and become more persistent. Conversely, in a positive scenario, an MACD improvement would reinforce the possibility of XRP retesting the recent high set on Sunday at $1.67.
Related Articles
XRP Price Could Double with BlackRock ETF Filing, Analysts Predict
Standard Chartered Cuts XRP Price Target by 65% After February Crypto Sell-Off
XRP Price Rebounds 30% From $1.10 Low as $1.62 Resistance Comes Into Focus