Bitcoin faces a "deadline" Power Law at the end of 2026
Bitcoin has until the end of the year to recover; otherwise, the Power Law model may be considered invalid.
The Power Law model is not a price prediction. It is a regression model over time that views Bitcoin’s long-term price trajectory as a power curve. The concept of “deadline” essentially revolves around a dynamic floor— the lower boundary of the model— which continuously rises each day regardless of short-term price volatility.
If Bitcoin remains sideways or declines sharply in the coming months, this floor will gradually approach the market price. At that point, it could be the first time in history that the price breaks below the model’s lower boundary— which has closely tracked the asset’s historical data for many years.
As of mid-February 2026, the Newhedge Power Law tracker indicates:
Since the model is anchored over time from the genesis block on 01/03/2009, and grows approximately as a power of 5.8, the floor increases about 0.093% daily— roughly $47 per day at current levels.
Projection:
If the price stays around $67,000 for several months, the floor will catch up around mid-December. Any significant dip into the $60,000 range in Q4 could trigger the story of “first Power Law breach.”
What is the Power Law model?
The Power Law chart of Bitcoin describes the long-term price trajectory using a power function over time, often appearing as a straight line on a log–log graph.
This model is often associated with astrophysicist Giovanni Santostasi. Instead of a single line, most charts use a “band” that includes:
Santostasi views the Power Law as a way to describe Bitcoin as a scale-invariant growth system, emphasizing that the model can be tested— meaning it has clear criteria for rejection. For example: if the weekly closing price falls below the lower band in a predetermined set of weeks, the model is considered failed. Without predefined quantitative rules, every “break” can be justified as noise.
Why is the October milestone noteworthy?
“October deadline” is not a forecast but a mechanical consequence of the time-based model. Even if the price remains stable, the floor increases daily. The sideways market thus becomes a countdown: the safety margin continually narrows.
By the end of October, the floor will enter the $60,000 range. If the price remains below this zone for a sufficient period, headlines like “Bitcoin Breaks Power Law Floor for the First Time” could emerge.
This does not mean Bitcoin “loses value,” but rather that a specific parameter of the model is invalidated. It could also imply a change in growth regime compared to historical patterns— slower than the long-term curve.
One common counterargument is from Amdax, with representative Tim Stolte, who suggests that power-law fits for Bitcoin may be spurious correlations, highly sensitive to the chosen data window.
Sufficient volatility to break the floor
A 4–6% drop from current levels— enough to reach the $60,000 zone— is entirely normal for Bitcoin. Recent volatility indicates about 51.77% annualized.
Deribit provides a conversion rule: divide the annual volatility by the square root of 365 (about 19) to estimate daily volatility— roughly a few percent per day. A macro risk-off shock could easily push the price down to the low $60,000s or below.
On the institutional side, Fidelity Investments— through analysis by Jurrien Timmer— has also considered around $65,000 as a “critical threshold.” When both institutional commentary and technical models converge on a price zone, that area tends to become a market expectation nexus.
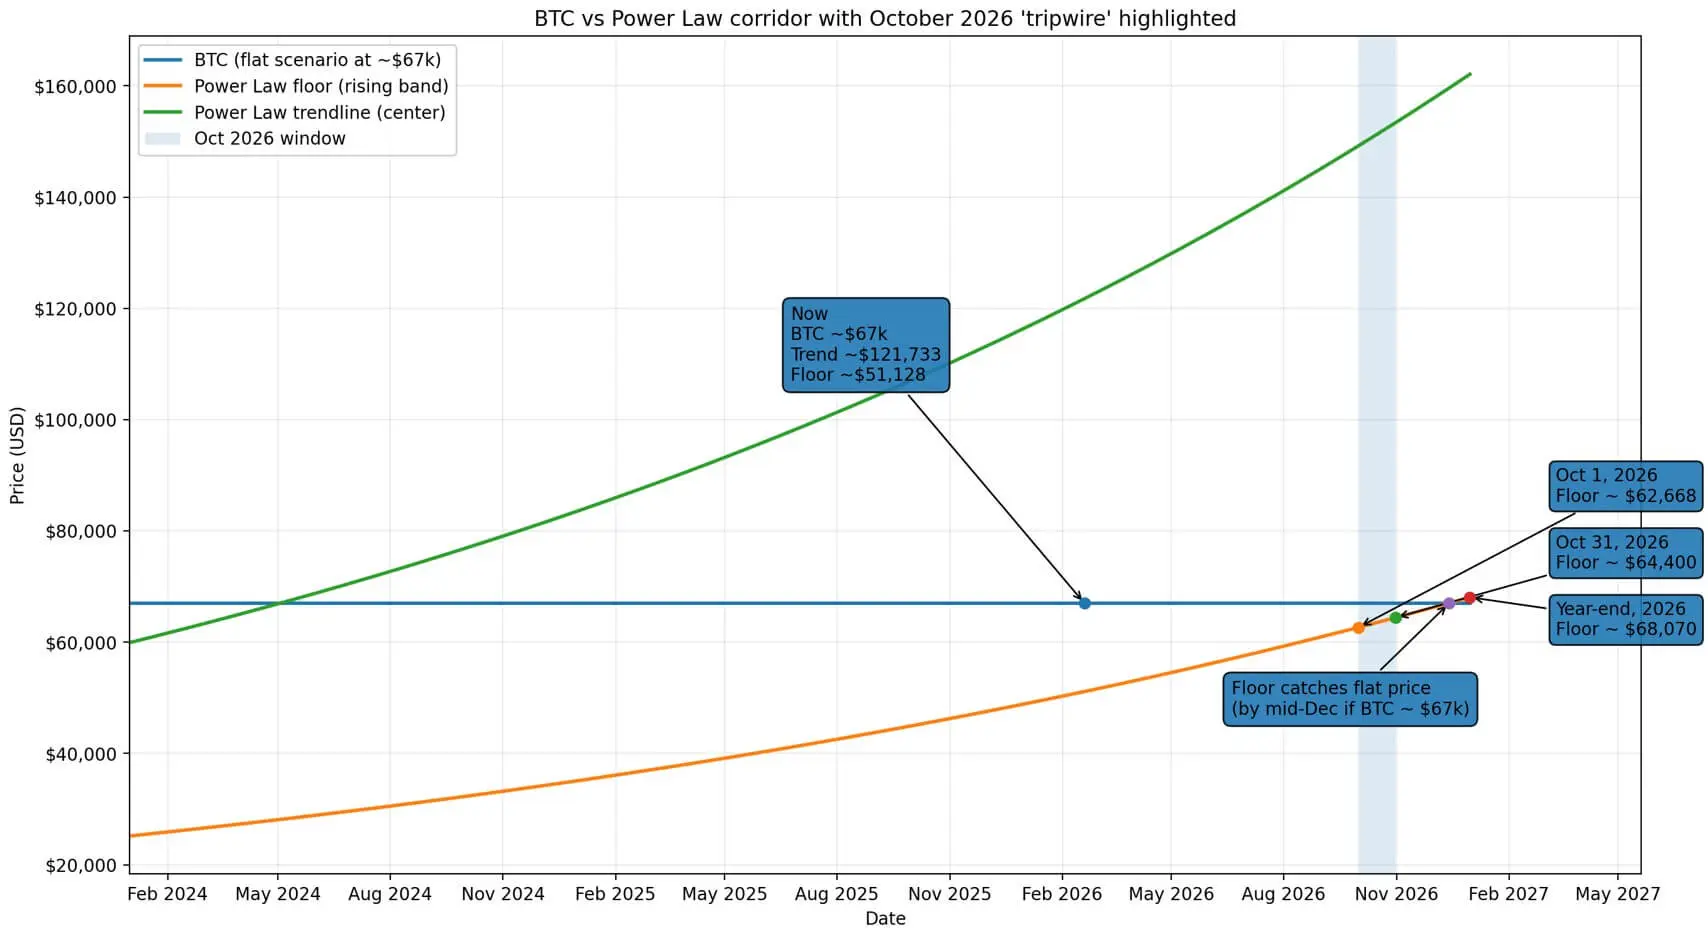 The chart shows the distribution curve of Bitcoin following a power law increasing toward the current price, projected to reach $64,400 by the end of October 2026.## Four Q4 scenarios
Scenario 1— Sideways with risk
The longer the accumulation, the closer the floor gets. The safety margin gradually disappears over time.
Scenario 2— Volatility making a breach possible
A two-digit percentage fluctuation within a month is normal in the current volatile environment. A short, sharp dip could trigger an immediate test of the floor.
Scenario 3— Market psychology anchoring
The $60,000 zone appears repeatedly in both the Power Law model and institutional commentary. When many see a price as significant, it becomes so through reflexive expectation effects.
Factors that could cause deviation from the model
The model does not incorporate causative variables, but actual trading depends heavily on:
Power Law assumes continuous growth, while markets often experience jumps. Macro risk-off shocks or capital withdrawal from ETFs can create gaps from the smooth trend line.
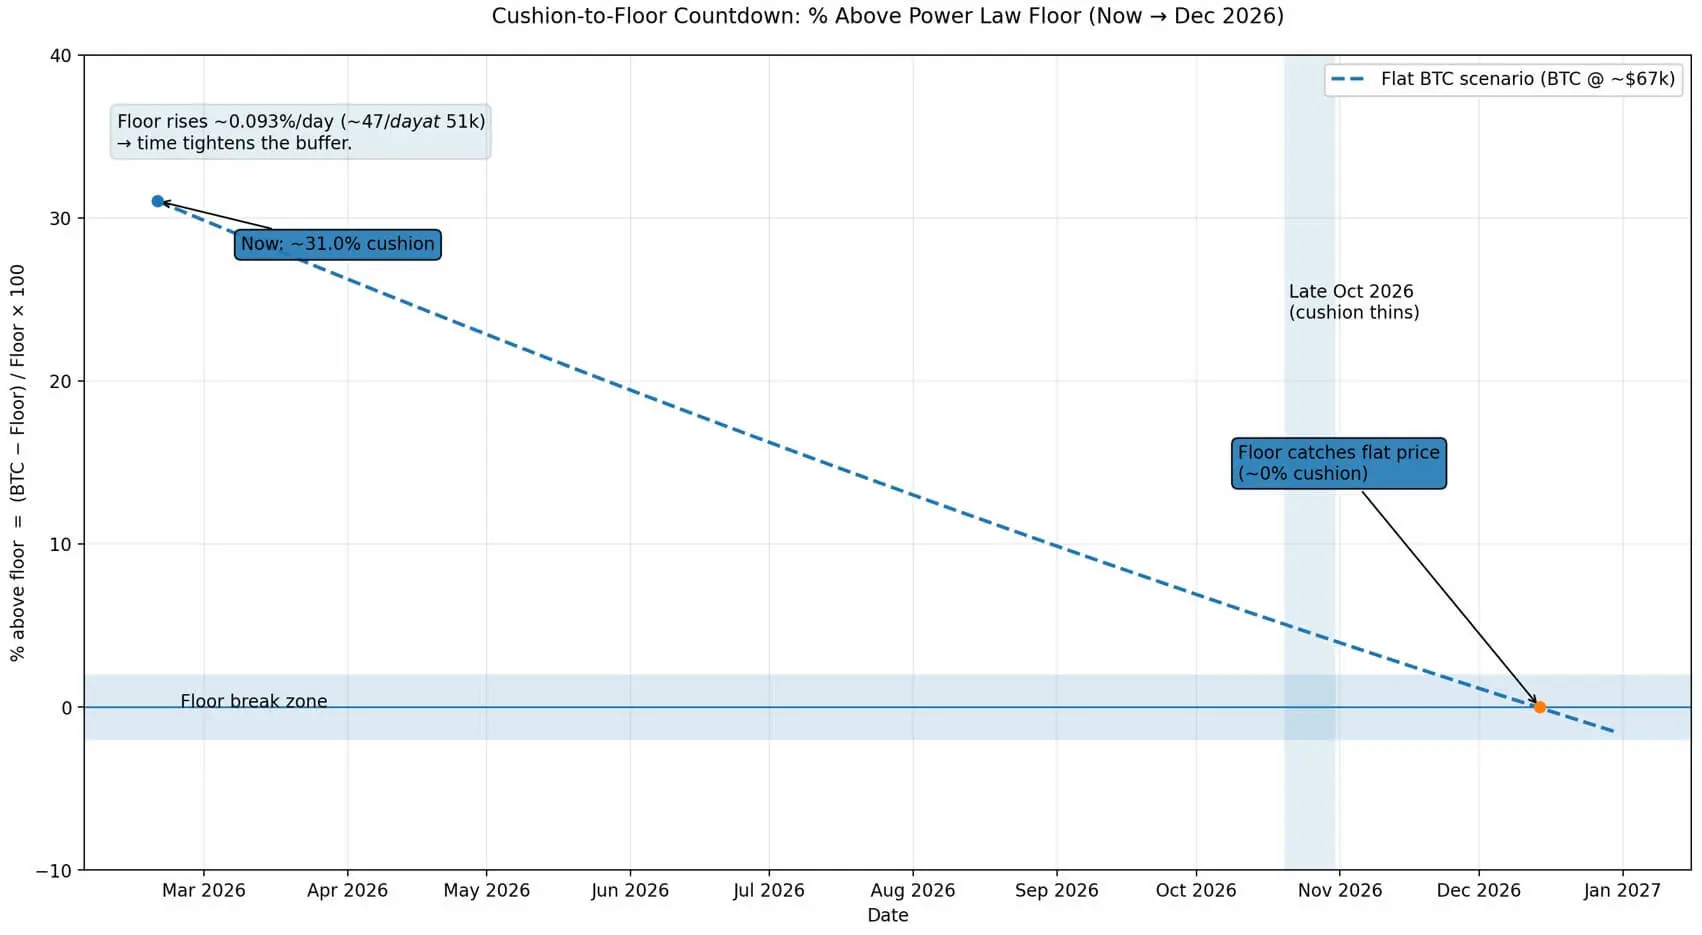 The current 31% deviation of Bitcoin from the power-law floor will reduce to zero by mid-December if the price remains unchanged.## What if the floor is broken?
Breaking the floor does not negate Bitcoin itself but invalidates a specific parameter of the model. It could mean:
A scholarly paper early 2026 still supports a time-based power-law form but estimates a flatter slope (around 4.2 instead of 5.8) and proposes “adjustment time based on activity” to improve fit. Even supportive research admits parameters are unstable.
Key indicators to monitor
The October milestone is not a prophecy. It is a mechanical consequence of the time regression: the floor increases daily. If the price remains sideways or declines, the floor will catch up. The next eight months will be a clear test of the model’s true predictive value.
Vương Tiễn
Related Articles
Bitcoin Whales Retreat as Retail Investors Buy: Market Trends Reveal Divide
When the "Old Map" No Longer Applies: A Review of 8 "Failing Classic Cryptocurrency Indicators"
Analysis: BTC believers' holdings have hit a new high for this cycle, and the bottom of the bear market is no longer far away.