Stablecoin Supply Hits $329B as $10T Monthly Volume Signals On-Chain Revival
Record stablecoin supply and $10T volume show liquidity is rising but still partly parked on the sidelines.
Stablecoin liquidity is expanding again as recent reports point to renewed capital circulation across crypto markets. Transfer activity has accelerated sharply, while total supply now sits at record levels. On-chain settlement appears to be regaining structural momentum.
Stablecoin Market Rebounds to New Highs, DEXs Capture 56% of Activity
As per data from Dune Analytics, the combined stablecoin balance stands at about $329.6 billion. Last month alone, the sector pulled in over $10 trillion in transfer volume, the strongest monthly reading since April 2022. Decentralized exchanges made up 56% of all stablecoin activity during that time.
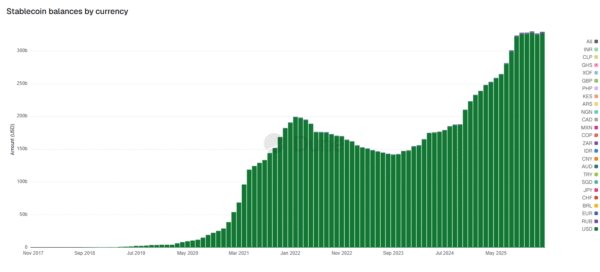
_Image Source: _Dune Analytics
In recent years, the stablecoin supply has moved through three main phases. From 2020 to 2022, balances grew quickly and reached nearly $200 billion. During the 2022–2023 market drop, supply slid to around $140–150 billion.
However, growth returned in the succeeding year. And now balances have climbed above $320 billion, setting a new record.
Stablecoins pegged to USD continued activities within the sector. In comparison, its non-USD counterparts account for just over $2 billion combined. For context, this figure is less than 1% of the total stablecoin supply.
Data Reveals Billions Flowing In and Out as Positioning Shifts
Data from Kaiko gives a clearer view of market trends by looking at Bitcoin, Ethereum, and stablecoin dominance. During the market downturn, many investors moved into stablecoins for safety. And in turn, this increased their share of the market.
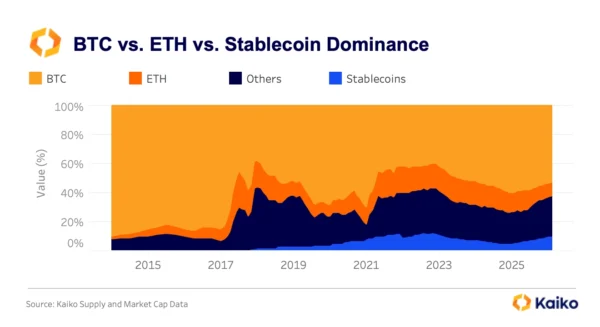
_Image Source: _Kaiko
As confidence slowly returned, some of that money rotated back into risk assets like Bitcoin and Ethereum. Even so, stablecoins still hold a larger share of the market compared to earlier cycles.
Current positioning implies liquidity is present but not fully committed.
- Significant capital remains parked in stablecoins.
- Risk rotation has resumed but remains measured.
- Speculative allocation has not reached prior extremes.
- Ample “dry powder” still sits on the sidelines.
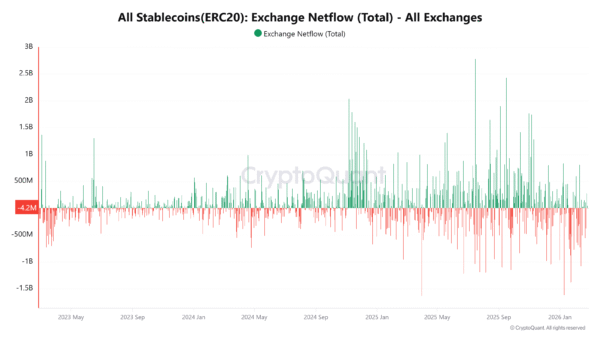
_Image Source: _CryptoQuant
According to CryptoQuant, daily inflows of $1–2.5 billion occurred frequently over the past two years. Oftentimes, these large inflows happen before traders open spot or futures positions. At the same time, heavy outflow days exceeding $1 billion reflect rapid capital relocation.
Stablecoins Shift On-Chain as DEX Activity Rises and $80B Sits on CEXs
Recent data shows that stablecoins are steadily leaving centralized exchanges, while activity on DEXs continues to rise. This suggests funds are moving on-chain rather than leaving the crypto market.
Even so, centralized exchanges still hold around $80 billion in stablecoins. That represents significant sidelined buying power. With total supply at record highs, overall market liquidity remains solid.
Stablecoin velocity now matches supply growth, with $10 trillion in monthly transfers confirming faster capital turnover. Even more, rising DEX participation suggests structural evolution in how liquidity circulates.
Related Articles
ETH short-term decline of 1.08%: Extreme panic sentiment and capital flow leading to short-term selling dominated by BTC
Solana at a Make-or-Break Level: $77 Support Tested After Sharp 24H Selloff
HBAR Consolidates at $0.095 as Critical $0.094–$0.096 Zone Draws Focus
Bitcoin, Ethereum Traders Show Optimism Despite 'Extreme Fear' in Crypto
BTC short-term decline of -0.59%: Whales reducing positions and insufficient liquidity driving the price down
SUI Outpaces TRON and Cardano in 2026 Liquidity Race