Ethereum sets usage record, but ETH approaches the longest downtrend chain since 2018
Ethereum is approaching a milestone that few investors want: the longest monthly downtrend since the 2018 crypto winter.
Since September 2025, ETH has closed in the red for six consecutive months, causing its price to drop about 60% from the all-time high of $4,953 in August 2025 to below $2,000.
Such a prolonged decline is rare for a network that continues to set transaction volume records. This contrast makes the current period particularly noteworthy.
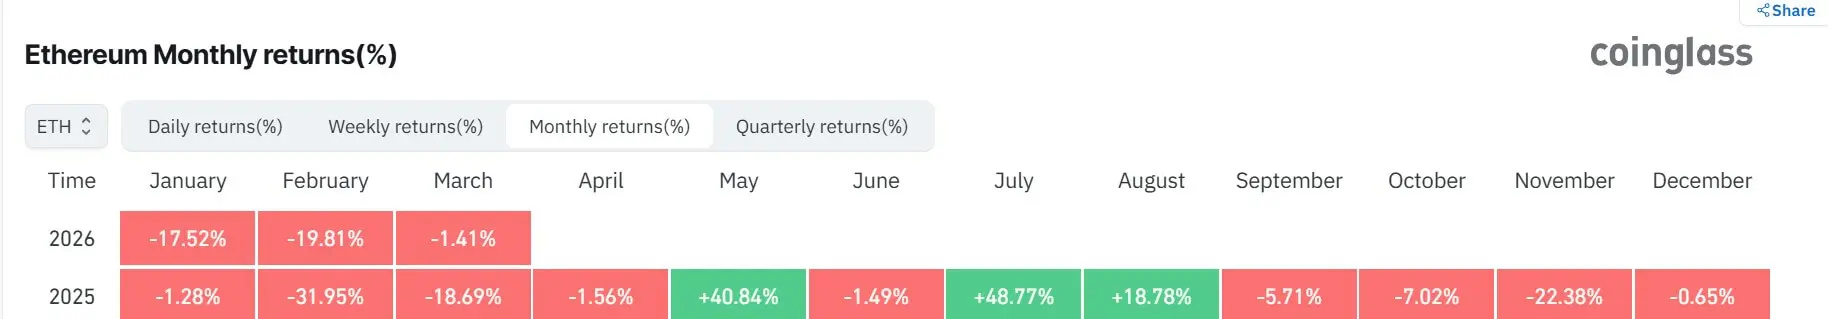 Ethereum’s monthly profit from January 2025 to present (Source: CoinGlass) The issue isn’t just ETH’s price decline. This downward streak indicates the market is re-evaluating Ethereum’s value amid strong network activity, but the mechanisms that previously supported bullish arguments for ETH are now harder to model.
This makes the current correction different from the 2018 crash, when the entire crypto market was experiencing a surge in ICOs, and most projects were still trying to prove product-market fit.
By 2026, Ethereum is a more mature network: playing a broader role in the institutional financial system, with larger on-chain activity, and expanded applications in asset tokenization, stablecoins, and layer-2 solutions. Yet, the token representing that ecosystem still struggles to maintain its value.
Bitcoin as an index, ETH as a high-beta asset
During broad crypto market sell-offs, Bitcoin increasingly acts as a benchmark index, while ETH trades more like a high-beta asset of the sector.
This is especially important as liquidity dries up and market sentiment turns defensive. ETH’s market depth is shallower than Bitcoin’s, leverage use is higher, and marginal buyers are more sensitive to macro volatility.
When risk capital flows out, this structure can cause the overall crypto decline to hit ETH harder, especially as derivatives—rather than spot markets—are leading the trend.
Data from CoinGlass shows ETH futures open interest has fallen 65% from a peak near $70 billion in August 2025 to around $24 billion. This sharp decline reflects reduced risk appetite in the system.
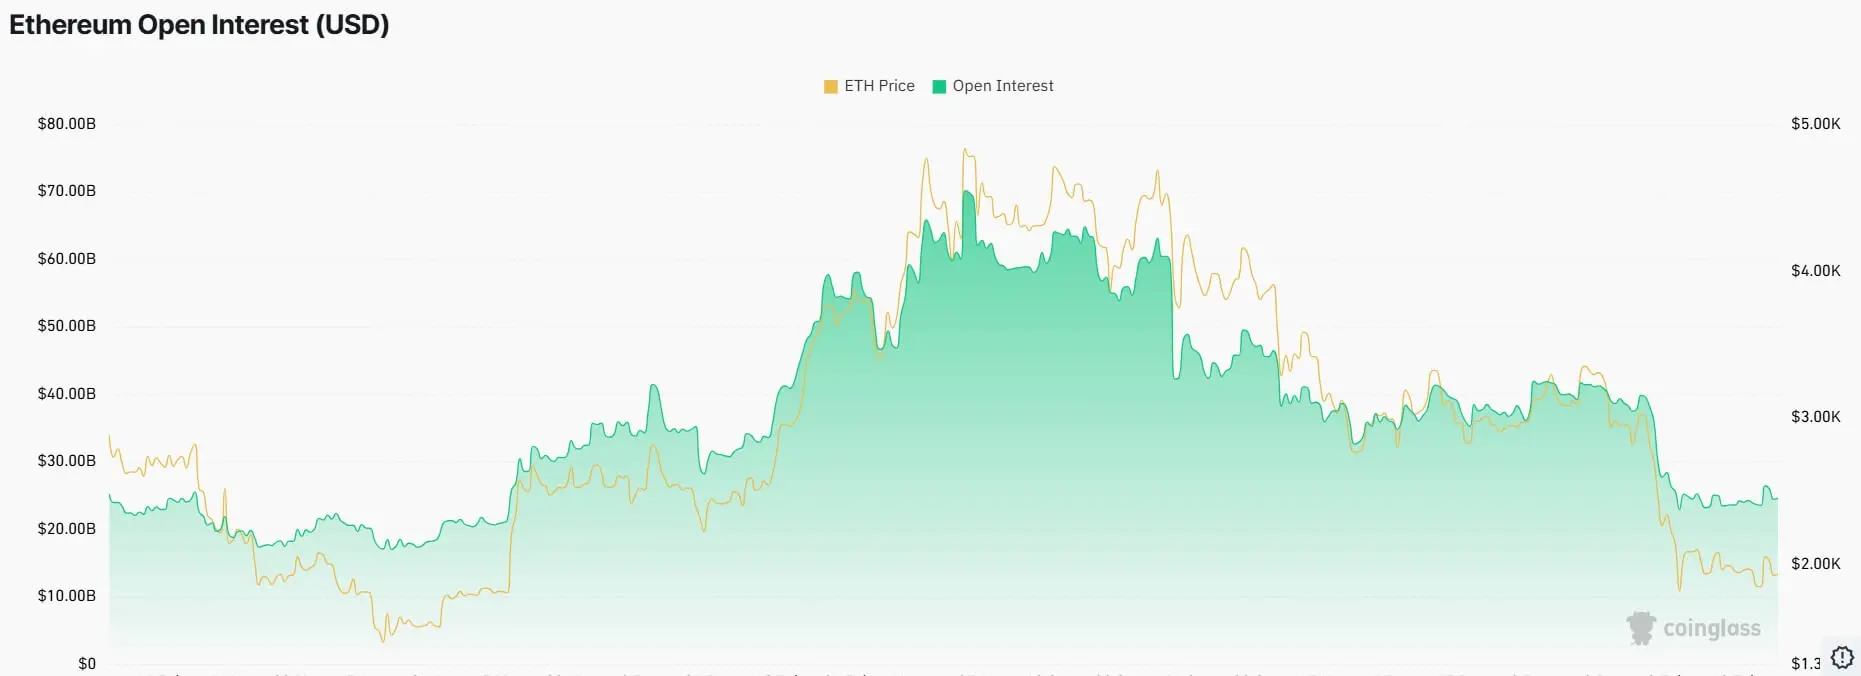 Ethereum open interest (Source: CoinGlass) However, this also means ETH’s price is forming in a market where forced position changes—liquidations, hedging, or rollovers—may overshadow active buying when traders reduce leverage.
Options markets also reflect similar stress. Short-term volatility has surged, and deep negative skew indicates investors are willing to pay higher premiums to hedge against downside risk rather than bet on upside. In other words, the market not only expects volatility but also prioritizes protection against sharp declines.
With 7-day implied volatility around 70%, a one standard deviation range suggests price swings of about ±200 USD within a week around the spot price of 1,950 USD. Over a month, this expands to roughly ±430 USD, and over a quarter, about ±740 USD.
These are not price targets but measures of the uncertainty the market is pricing in for upcoming scenarios.
Capital flows still not supporting the bulls
Derivatives markets explain how prices fluctuate but don’t fully account for why dips haven’t attracted sustained buying.
Two main signals for ETH remain weak.
First is the ETF story. Over the past four months, U.S.-listed Ethereum ETFs have seen a total net outflow of about $2.6 billion. This is significant not only because of immediate selling pressure but also because it reflects institutional commitment levels. When ETF flows are not structurally positive, rallies rely more on derivatives—potentially amplifying fragility.
Meanwhile, accumulation by digital asset treasury firms has slowed considerably. BitMine remains one of the few large buyers recently, while some others have shifted toward tokenized real assets.
Second is stablecoin supply—a real-time indicator of intrinsic market buying power. Recently, stablecoin growth has slowed sharply. Tether’s USDT market cap has even contracted for two consecutive months, indicating new liquidity isn’t expanding. This hasn’t happened since the 2022 crisis.
For Ethereum, past bullish cycles often involved expanding on-chain buying power. When stablecoin growth stalls, price volatility can turn into capital rotation and leveraged trading rather than sustained spot accumulation.
Ethereum scaling, but the valuation story more complex
Unlike 2018, Ethereum now has more active network usage and effective scaling solutions. The 7-day average of transactions has hit a record near 2.9 million per day.
This growth stems from applications like real asset tokenization, along with lower transaction costs thanks to technical improvements. However, scaling also complicates valuation frameworks.
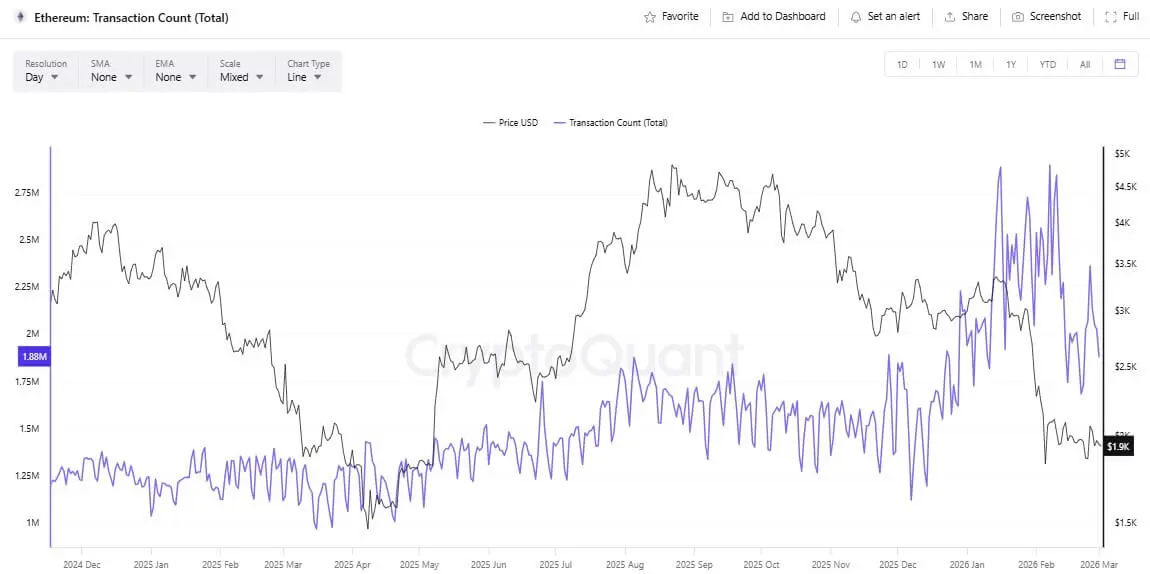 Ethereum daily transaction count (Source: CryptoQuant) The “ultrasound money” narrative after The Merge, reinforced by EIP-1559 and fee burning, once raised hopes that ETH could become a deflationary asset. This mechanism still functions when demand for block space rises and transaction fees increase.
But in the post-Dencun environment, with blob data enabling cheaper rollups and layer-2 fees decreasing, the burning pressure at layer-1 weakens under normal conditions. There are periods when ETH issuance exceeds burning, weakening the “perpetual deflation” thesis.
This forces the market to debate more deeply how Ethereum captures value in the future as rollups dominate. The network might continue to grow as a settlement layer, but the direct monetary value proposition of the token becomes harder to compare with familiar models like buybacks or dividends.
What could end the downtrend?
Three main scenarios are emerging
Scenario one is a “capitulation and reset” phase. If by March 2026 prices continue to close lower, the downtrend will match the 2018 record. ETF outflows persist, stablecoin supply remains flat, and options markets remain heavily skewed toward downside hedging. Price could test lower levels within implied volatility bounds.
Scenario two is a prolonged accumulation phase. Leverage continues to be drained, volatility stays high but stabilizes, and ETH fluctuates within a broad range amid uncertain macro trends. Application activity and layer-2 adoption may improve, but prices won’t immediately reflect this due to limited liquidity.
Scenario three is a liquidity turnaround. A sustainable recovery might require more positive macro momentum, stable ETF flows, and renewed stablecoin growth. Then, the market could reassess Ethereum’s growth story, shifting focus from fee compression to the network’s indispensable role in a larger economic surface.
In summary, Ethereum isn’t simply repeating 2018. The market is testing a new narrative amid intense pressure. ETH is becoming more useful, but during downturns, transforming usage into direct token value is less straightforward than before.
The tension between ecosystem growth and value capture mechanisms, along with macro risk appetite and capital quality via ETFs, stablecoins, and derivatives, will determine whether this downtrend is just a painful chapter or the start of a prolonged revaluation process.
Related Articles
Data: If ETH breaks through $2,047, the total liquidation strength of short positions on mainstream CEXs will reach $733 million.
Bitmine Expands Ethereum Holdings as Staking Network Nears Launch
Massive ETF Inflows: BTC, ETH, SOL, XRP See $521M Surge
ETH short-term increase of 1.04%: Spot buying driven and deflation expectations resonate to amplify the rally
Bitmine scans another 50,000 ETH! Tom Lee Looks Forward to a Rebound in March