Comparez LL et GMX : analyse complète de LightLink Layer 2 et des protocoles d’échange perpétuel décentralisés. Retrouvez les prix historiques, la tokenomics, les stratégies d’investissement, les prévisions pour 2026-2031 ainsi que les facteurs de risque sur Gate pour déterminer quel actif crypto offre la meilleure valeur d’investissement.
Introduction : Comparatif d’investissement LL vs GMX
La comparaison entre LL et GMX s’impose comme un passage obligé pour les investisseurs du marché des cryptomonnaies. Ces deux projets se démarquent tant par leur rang en capitalisation, leurs cas d’usage et leurs performances de prix que par leur positionnement distinct au sein des actifs numériques.
LL (LightLink) : Lancé en 2024, LL a rapidement bénéficié d’une reconnaissance sur le marché en tant que blockchain Ethereum Layer 2, proposant des transactions instantanées sans gaz pour les dApps et les entreprises.
GMX : Dès son lancement, GMX s’est établi comme plateforme décentralisée d’échanges perpétuels et figure parmi les projets majeurs en termes de volumes de trading sur le secteur DeFi.
Cet article propose une analyse complète du potentiel d’investissement comparé entre LL et GMX, autour des tendances historiques des prix, des mécanismes d’offre, de l’adoption institutionnelle, des écosystèmes techniques et des perspectives à venir, dans le but de répondre à la question principale des investisseurs :
"Quel est le meilleur achat actuellement ?"
I. Comparaison historique des prix et état actuel du marché
Évolution historique des prix de LL (Coin A) et GMX (Coin B)
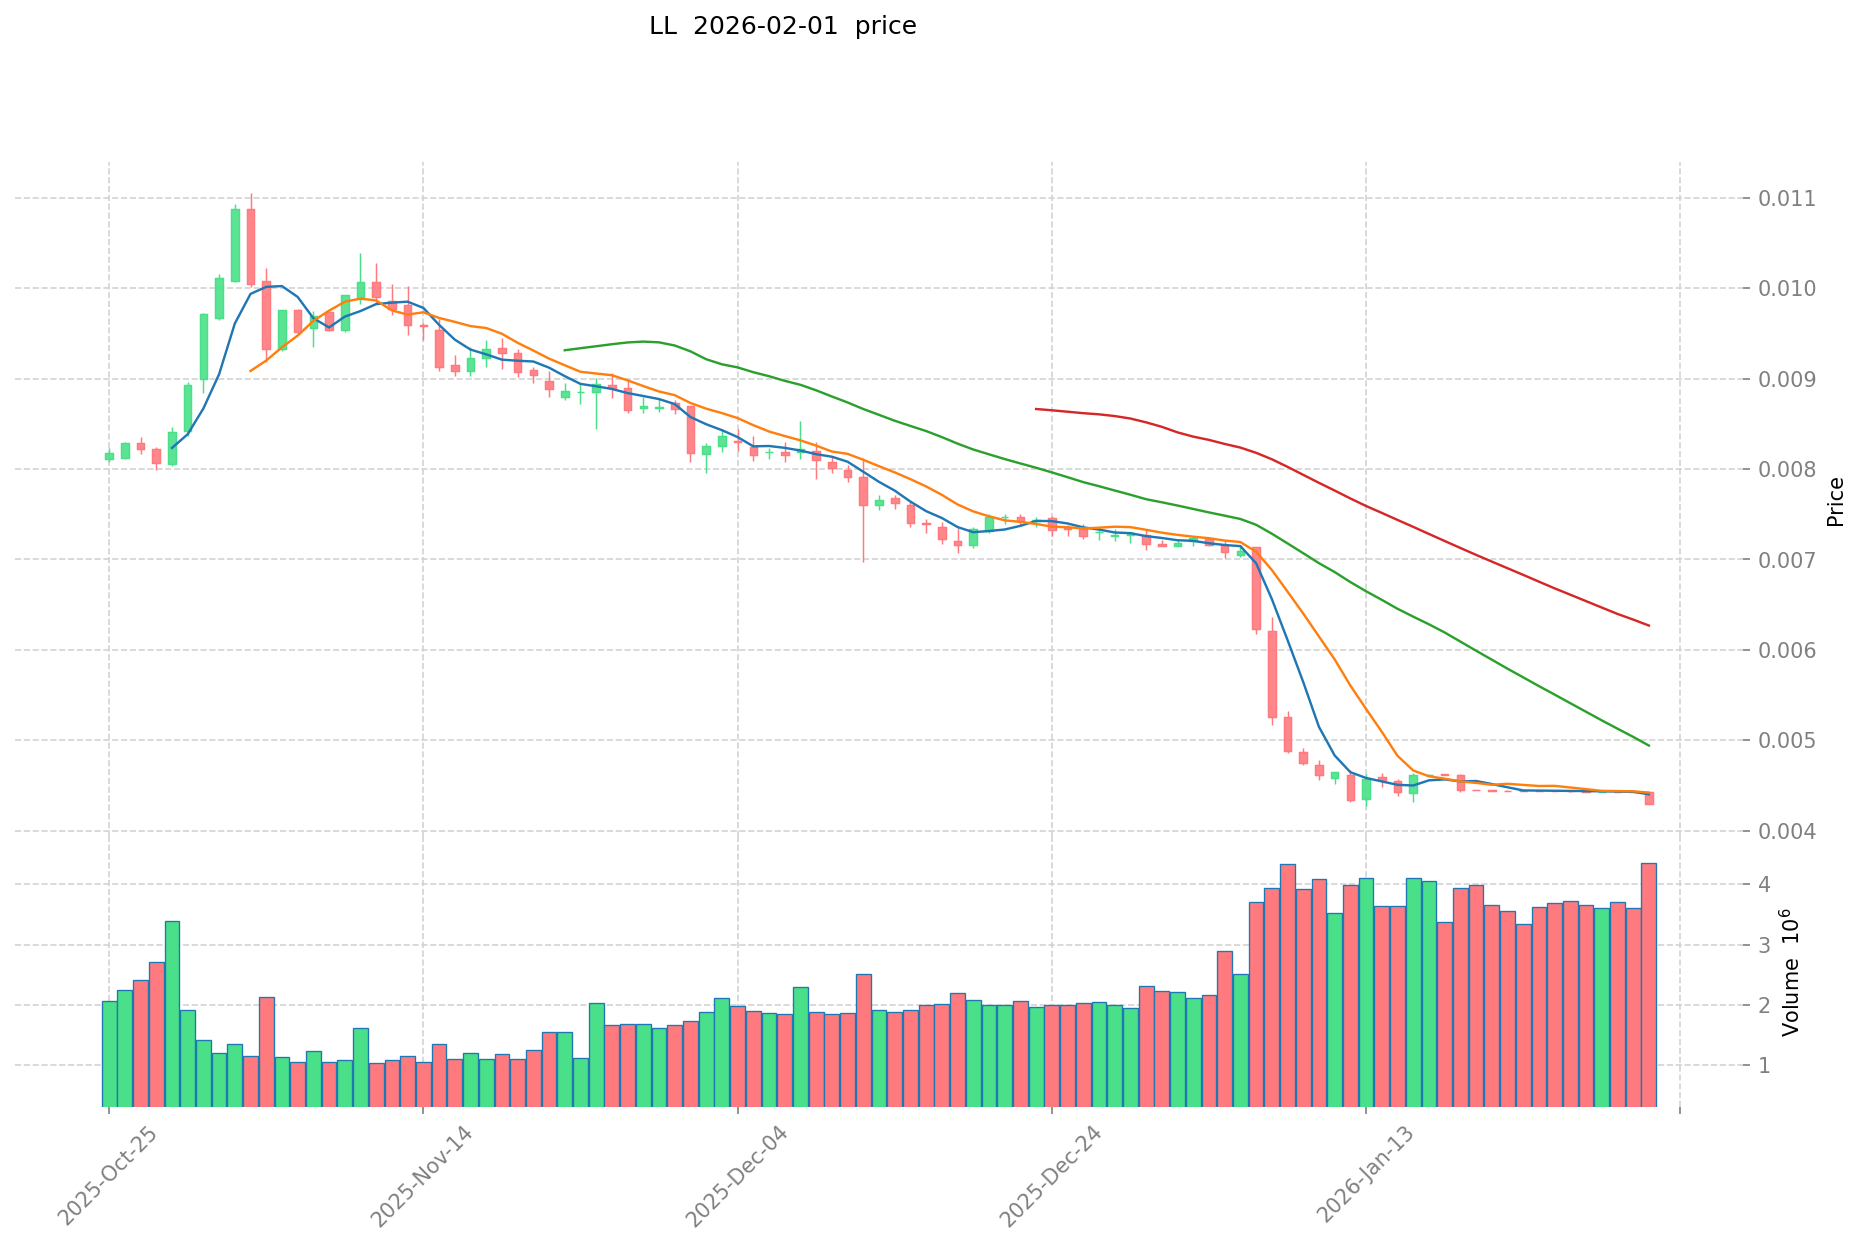
- 2024 : LL a atteint son plus haut historique à 0,3 $ le 24 avril 2024, lors de sa première cotation sur les plateformes d’échange.
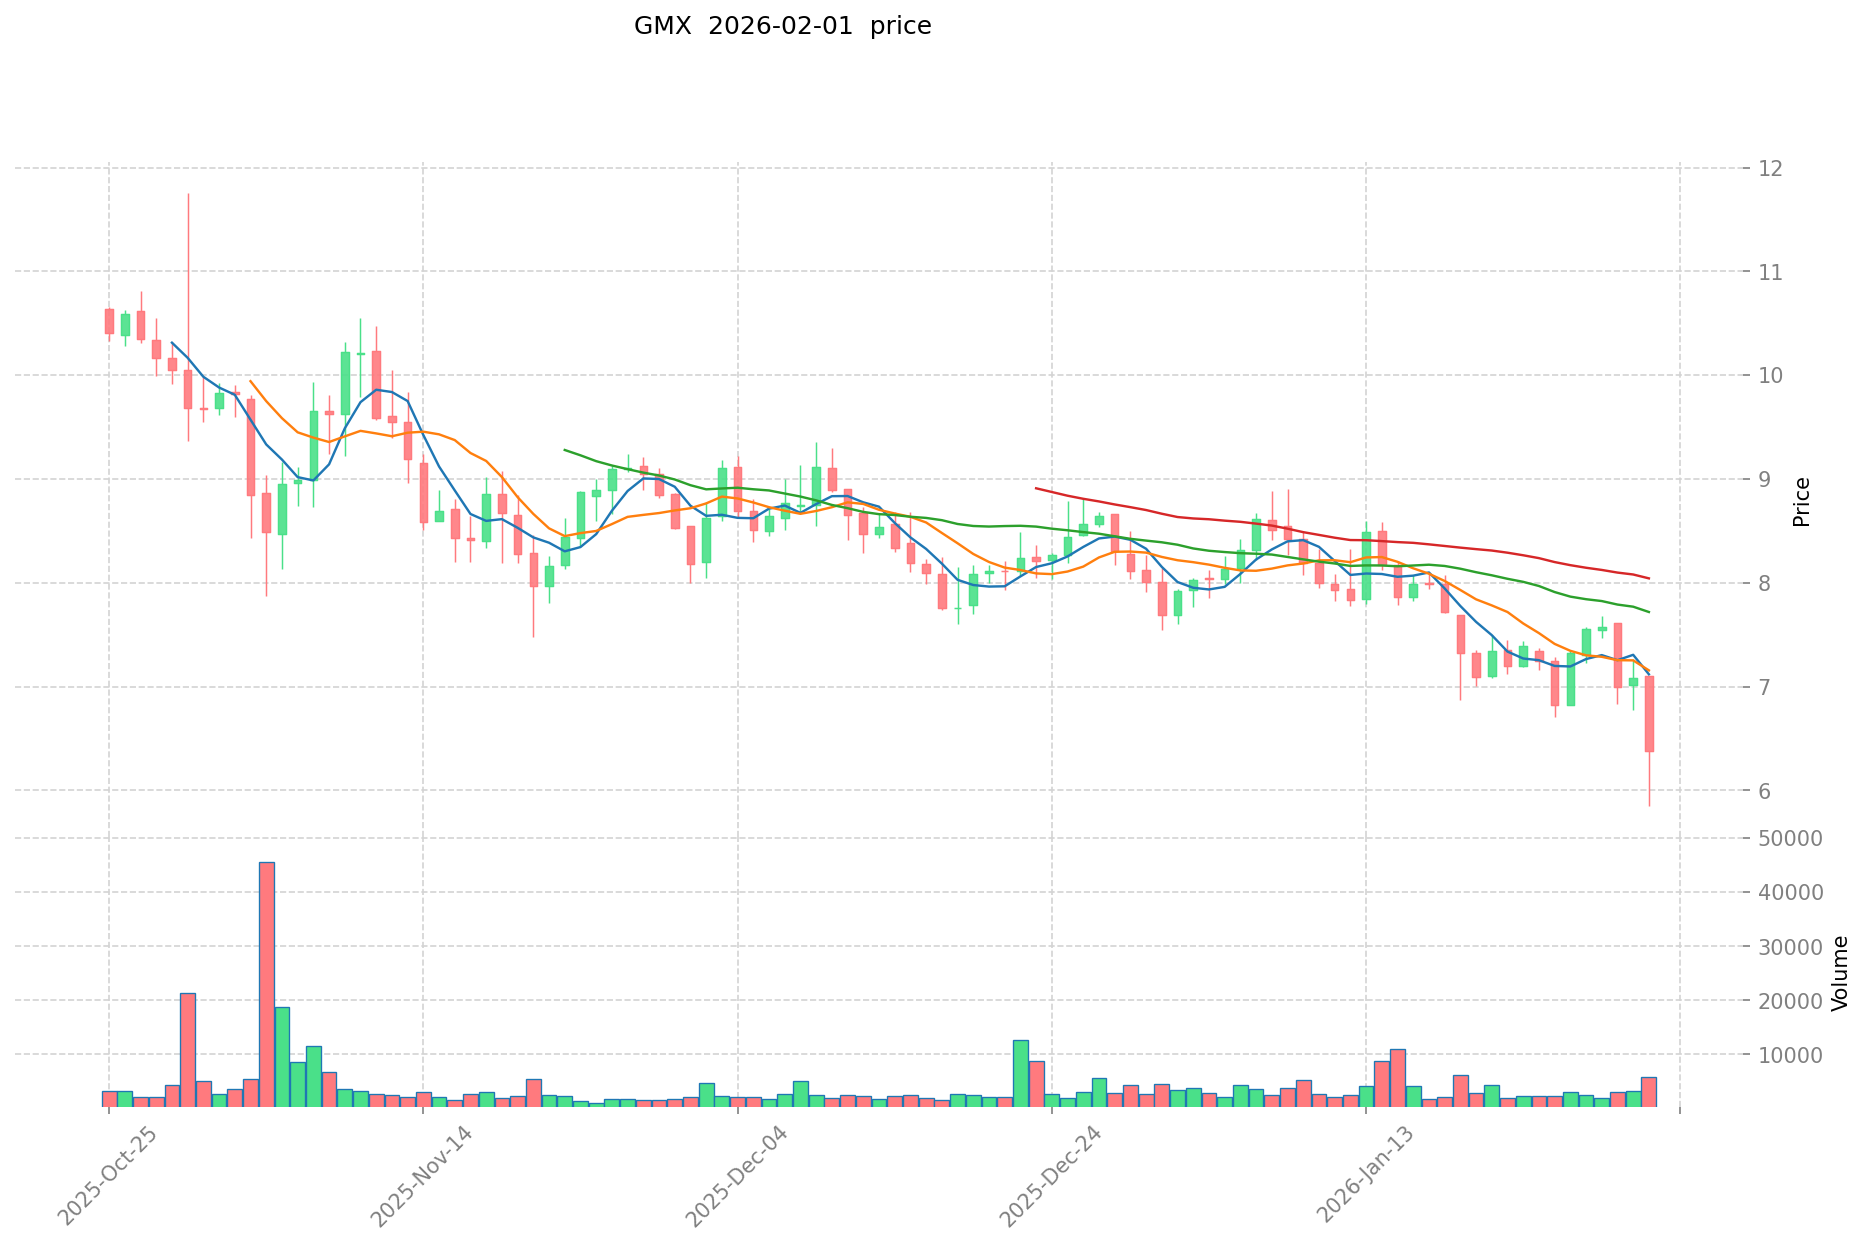
- 2023 : GMX a connu une forte volatilité avec un record à 91,07 $ le 18 avril 2023, à l’occasion d’une période intense sur les échanges perpétuels décentralisés.
- 2026 : Les deux tokens ont subi une pression baissière marquée. LL est passé de son sommet à un plus bas à 0,004265 $ le 1er février 2026. GMX a également touché son plus bas historique à 6,06 $ à la même date, illustrant les difficultés du marché global.
- Analyse comparative : Sur le cycle 2023-2026, LL a perdu environ 98,6 % de sa valeur, passant de 0,3 $ à 0,004265 $. GMX affiche une baisse similaire, d’environ 93,3 %, de 91,07 $ à 6,06 $.
Situation actuelle du marché (1er février 2026)
- Prix actuel LL : 0,004295 $
- Prix actuel GMX : 6,236 $
- Volume d’échange sur 24h : LL enregistre 21 209,96 $ contre 36 893,51 $ pour GMX
- Indice de sentiment du marché (Fear & Greed Index) : 14 (Peur extrême)
Consulter les prix en temps réel :
II. Facteurs clés influençant la valeur d’investissement LL vs GMX
Comparaison des tokenomics
D’après les éléments disponibles, l’analyse des mécanismes d’offre propres à LL et GMX nécessite des données complémentaires. La valeur d’investissement semble dépendre avant tout, selon la tendance du marché, des modèles d’adoption technologique, de la force de la communauté et du développement fondamental du projet, plutôt que des seuls mécanismes d’offre.
- 📌 Analyse historique : Les mécanismes d’offre de tokens peuvent influencer les cycles de prix, mais les détails sur les modèles d’offre de LL et GMX restent limités dans les ressources actuelles.
Adoption institutionnelle et applications de marché
- Détention institutionnelle : Les références disponibles ne fournissent pas de données comparatives sur la préférence institutionnelle pour LL ou GMX.
- Adoption en entreprise : Les cas d’usage concrets en paiements transfrontaliers, systèmes de règlement ou portefeuilles d’investissement pour LL et GMX ne sont pas documentés dans les sources actuelles.
- Environnement réglementaire : Les positions politiques nationales à l’égard de LL et GMX demeurent non précisées selon les sources fournies.
Développement technologique et construction de l’écosystème
- Progrès technologique de LL : Les informations disponibles ne permettent pas d’évaluer les évolutions techniques ou le développement de l’écosystème.
- Évolution technologique de GMX : Les données sont limitées sur les avancées techniques actuelles ou l’expansion de l’écosystème.
- Comparaison des écosystèmes : Les sources ne détaillent pas la mise en œuvre concrète de l’intégration DeFi, des applications NFT, des solutions de paiement ou du déploiement de smart contracts pour LL et GMX.
Environnement macroéconomique et cycles de marché
- Performance en environnement inflationniste : Les données disponibles ne permettent pas d’établir les propriétés anti-inflation comparées de LL et GMX.
- Politique monétaire macroéconomique : L’impact des taux d’intérêt et de l’indice dollar sur LL et GMX reste non documenté dans les sources.
- Facteurs géopolitiques : Les besoins de transactions transfrontalières et l’influence de la situation internationale sur ces actifs ne sont pas étayés dans les documents actuels.
III. Prévisions de prix 2026-2031 : LL vs GMX
Prévision à court terme (2026)
- LL : Fourchette conservatrice 0,00262 $ - 0,00430 $ | Fourchette optimiste 0,00430 $ - 0,00468 $
- GMX : Fourchette conservatrice 6,05 $ - 6,23 $ | Fourchette optimiste 6,23 $ - 8,04 $
Prévision à moyen terme (2028-2029)
- LL pourrait entamer une phase de croissance progressive, avec des estimations de prix de 0,00391 $ - 0,00726 $ en 2028 et 0,00476 $ - 0,00957 $ en 2029
- GMX pourrait connaître une expansion modérée, avec une fourchette estimée de 5,04 $ - 11,51 $ en 2028 et 5,17 $ - 12,09 $ en 2029
- Moteurs principaux : afflux de capitaux institutionnels, développement des ETF, expansion des écosystèmes
Prévision à long terme (2030-2031)
- LL : Scénario de base 0,00592 $ - 0,00800 $ (2030) et 0,00830 $ - 0,00976 $ (2031) | Scénario optimiste 0,01152 $ (2030) et 0,01366 $ (2031)
- GMX : Scénario de base 5,90 $ - 10,92 $ (2030) et 8,37 $ - 11,30 $ (2031) | Scénario optimiste 11,69 $ (2030) et 15,94 $ (2031)
Voir les prévisions détaillées pour LL et GMX
Avertissement
LL :
| Année |
Prix haut prévisionnel |
Prix moyen prévisionnel |
Prix bas prévisionnel |
Variation de prix |
| 2026 |
0,00468155 |
0,004295 |
0,00261995 |
0 |
| 2027 |
0,00668752975 |
0,004488275 |
0,00359062 |
4 |
| 2028 |
0,0072642730875 |
0,005587902375 |
0,0039115316625 |
30 |
| 2029 |
0,009574870719562 |
0,00642608773125 |
0,004755304921125 |
49 |
| 2030 |
0,011520690084585 |
0,008000479225406 |
0,0059203546268 |
86 |
| 2031 |
0,013664818516993 |
0,009760584654995 |
0,008296496956746 |
127 |
GMX :
| Année |
Prix haut prévisionnel |
Prix moyen prévisionnel |
Prix bas prévisionnel |
Variation de prix |
| 2026 |
8,04057 |
6,233 |
6,04601 |
0 |
| 2027 |
8,8496134 |
7,136785 |
6,20900295 |
14 |
| 2028 |
11,510206848 |
7,9931992 |
5,035715496 |
28 |
| 2029 |
12,09211174976 |
9,751703024 |
5,16840260272 |
56 |
| 2030 |
11,6864409039616 |
10,92190738688 |
5,8978299889152 |
75 |
| 2031 |
15,938885545043328 |
11,3041741454208 |
8,365088867611392 |
81 |
IV. Comparatif des stratégies d’investissement : LL vs GMX
Stratégies d’investissement long terme vs court terme
- LL : Susceptible d’intéresser les investisseurs axés sur le potentiel de l’infrastructure Layer 2 et l’adoption blockchain en entreprise, notamment ceux attentifs au développement de la technologie des transactions sans gaz
- GMX : Convient aux investisseurs souhaitant une exposition à l’infrastructure d’échanges perpétuels décentralisés et au développement des protocoles DeFi
Gestion du risque et allocation d’actifs
- Investisseurs prudents : LL : 20-30 % vs GMX : 70-80 %
- Investisseurs dynamiques : LL : 40-50 % vs GMX : 50-60 %
- Outils de couverture : Allocation en stablecoins, stratégies d’options, diversification multi-actifs
V. Comparatif des risques potentiels
Risque de marché
- LL : Exposé à la volatilité des solutions Layer 2 émergentes et à une liquidité plus faible, avec un volume d’échange actuel de 21 209,96 $
- GMX : Soumis aux risques inhérents aux protocoles d’échange décentralisé et à la concurrence des plateformes de produits dérivés, avec un volume d’échange de 36 893,51 $ sur 24h
Risque technique
- LL : Enjeux de scalabilité, stabilité réseau dans les déploiements d’entreprise
- GMX : Vulnérabilités de sécurité du protocole, risque sur les smart contracts dans le trading perpétuel
Risque réglementaire
- Les évolutions réglementaires mondiales pourraient impacter différemment LL et GMX, avec des cadres de conformité distincts pour les solutions Layer 2 et les plateformes de produits dérivés décentralisés selon les juridictions
VI. Conclusion : Quel est le meilleur achat ?
📌 Synthèse de la valeur d’investissement :
- Atouts de LL : Infrastructure Ethereum Layer 2 axée sur les transactions sans gaz pour les entreprises ; potentiel d’expansion de l’écosystème pour le développement des dApps
- Atouts de GMX : Position établie sur le secteur des échanges perpétuels décentralisés ; volume de trading plus élevé, indiquant une liquidité potentiellement supérieure
✅ Recommandations d’investissement :
- Investisseurs débutants : Il est recommandé de commencer avec des allocations modestes sur l’un ou l’autre actif, compte tenu du sentiment de peur extrême (Fear & Greed Index : 14) et des fortes baisses depuis les sommets historiques
- Investisseurs expérimentés : Peuvent envisager une allocation diversifiée entre l’infrastructure Layer 2 (LL) et les protocoles DeFi (GMX) selon leur tolérance au risque et leur vision du marché
- Investisseurs institutionnels : Procéder à une analyse approfondie des fondamentaux technologiques, des trajectoires d’écosystème et du cadre réglementaire avant toute prise de position
⚠️ Avertissement sur les risques : Les marchés de cryptomonnaies présentent une volatilité extrême. Cette analyse ne constitue pas un conseil en investissement. LL et GMX ont connu des baisses importantes depuis leurs sommets historiques : LL a reculé d’environ 98,6 %, GMX d’environ 93,3 %. Il est essentiel d’évaluer soigneusement sa tolérance au risque et de n’investir que des capitaux pouvant être totalement perdus.
VII. FAQ
Q1 : Quelle est la différence de prix actuelle entre LL et GMX, et que signifie-t-elle ?
Au 1er février 2026, LL s’échange à 0,004295 $ tandis que GMX cote à 6,236 $, soit un écart de prix nominal important. Néanmoins, cet écart reflète avant tout leur positionnement distinct sur le marché : LL opère comme infrastructure Ethereum Layer 2 dédiée aux transactions sans gaz pour les entreprises, alors que GMX fonctionne comme protocole d’échange perpétuel décentralisé dans la DeFi. Les investisseurs doivent analyser ces actifs selon leur adoption technologique, le développement de leur écosystème et leur potentiel d’usage plutôt que sur le seul niveau de prix.
Q2 : Quel actif a connu la plus forte baisse depuis son record historique ?
LL a subi une baisse plus importante d’environ 98,6 % entre son sommet à 0,3 $ (24 avril 2024) et son plus bas à 0,004265 $ (1er février 2026), contre 93,3 % pour GMX de 91,07 $ (18 avril 2023) à 6,06 $ (1er février 2026). Les deux actifs ont subi une pression baissière marquée, en lien avec le sentiment de peur extrême (Fear & Greed Index : 14). Ces évolutions soulignent le risque élevé inhérent à ces investissements et la nécessité d’une gestion rigoureuse des positions.
Q3 : Quelles sont les fourchettes de prix projetées pour LL et GMX à l’horizon 2030 ?
Selon les prévisions de base pour 2030, LL pourrait évoluer entre 0,00592 $ et 0,00800 $, avec un scénario optimiste à 0,01152 $. Pour GMX, la fourchette de référence est de 5,90 $ à 10,92 $, avec une cible optimiste à 11,69 $. Ces projections reposent sur l’hypothèse d’afflux institutionnels, d’expansion des écosystèmes et de développements favorables sur les ETF. Toutefois, les prévisions de prix en cryptomonnaie sont très incertaines ; les résultats dépendront des conditions de marché, de la réglementation et des avancées technologiques.
Q4 : Comment se comparent les volumes d’échange sur 24h entre LL et GMX ?
GMX affiche un volume d’échange supérieur avec 36 893,51 $ contre 21 209,96 $ pour LL sur 24h, ce qui indique une liquidité potentiellement plus élevée pour GMX. Cette différence suggère une participation de marché plus dynamique et une meilleure flexibilité pour les détenteurs de GMX. Cependant, ces volumes restent modestes et il convient de tenir compte du risque de liquidité, en particulier lors de positions importantes, pouvant entraîner du slippage.
Q5 : Quelle stratégie d’allocation d’actifs est recommandée pour chaque profil d’investisseur ?
Pour les investisseurs prudents, une allocation conseillée pourrait être de 20-30 % LL et 70-80 % GMX, privilégiant le protocole d’échange décentralisé plus établi. Les profils dynamiques peuvent viser une répartition plus équilibrée de 40-50 % LL et 50-60 % GMX, afin d’exposer leur portefeuille à la fois à l’infrastructure Layer 2 et aux protocoles DeFi. Les débutants doivent privilégier de petites allocations, compte tenu du sentiment de peur extrême et de la forte volatilité historique. Tous les investisseurs doivent mettre en place une gestion rigoureuse du risque via des réserves en stablecoins, la diversification multi-actifs et des positions adaptées à leur tolérance – n’investir que des capitaux pouvant être intégralement perdus.
Q6 : Quels sont les principaux risques technologiques de LL et GMX ?
LL fait face à des défis de scalabilité et de stabilité réseau pour les usages en entreprise, les solutions Layer 2 devant garantir une fiabilité optimale pour des applications critiques et des transactions sans gaz. GMX est exposé aux risques inhérents aux protocoles d’échange perpétuel décentralisé, dont les vulnérabilités des smart contracts et la sécurité dans la gestion des positions à effet de levier. Ces deux actifs évoluent dans un environnement technologique très dynamique, où les mises à jour de protocole, la concurrence et d’éventuels problèmes techniques peuvent influencer l’adoption et la valeur d’investissement.
Q7 : Comment les évolutions réglementaires peuvent-elles impacter différemment LL et GMX ?
LL et GMX relèvent de cadres réglementaires différents du fait de leurs rôles fonctionnels distincts. LL, en tant qu’infrastructure Ethereum Layer 2 pour les entreprises, peut être soumis à des réglementations sur les paiements, la protection des données et les usages professionnels du blockchain selon les juridictions. GMX, plateforme d’échange perpétuel décentralisé, doit composer avec la réglementation sur les valeurs mobilières, les produits dérivés et la conformité DeFi, qui évoluent à l’échelle mondiale. Il est crucial de suivre l’évolution des politiques publiques dans la blockchain et la finance décentralisée, car tout changement peut affecter de manière asymétrique la viabilité et l’accès au marché de ces actifs.
Q8 : Quels facteurs doivent guider le choix entre LL et GMX ?
Les investisseurs doivent prioriser plusieurs critères : (I) Préférence sectorielle – croissance Layer 2 ou expansion DeFi ; (II) Tolérance au risque – LL ayant affiché une volatilité historique supérieure (baisse de 98,6 %) contre 93,3 % pour GMX ; (III) Besoin de liquidité – GMX, avec un volume de trading plus important, peut mieux répondre aux exigences de flexibilité ; (IV) Horizon d’investissement – le potentiel d’adoption professionnelle de LL pour les investisseurs long terme, et la solidité de GMX pour ceux qui ciblent la DeFi établie ; (V) Diversification – LL et GMX peuvent jouer des rôles complémentaires dans un portefeuille crypto axé sur l’infrastructure et les applications du blockchain.
* Les informations ne sont pas destinées à être et ne constituent pas des conseils financiers ou toute autre recommandation de toute sorte offerte ou approuvée par Gate.